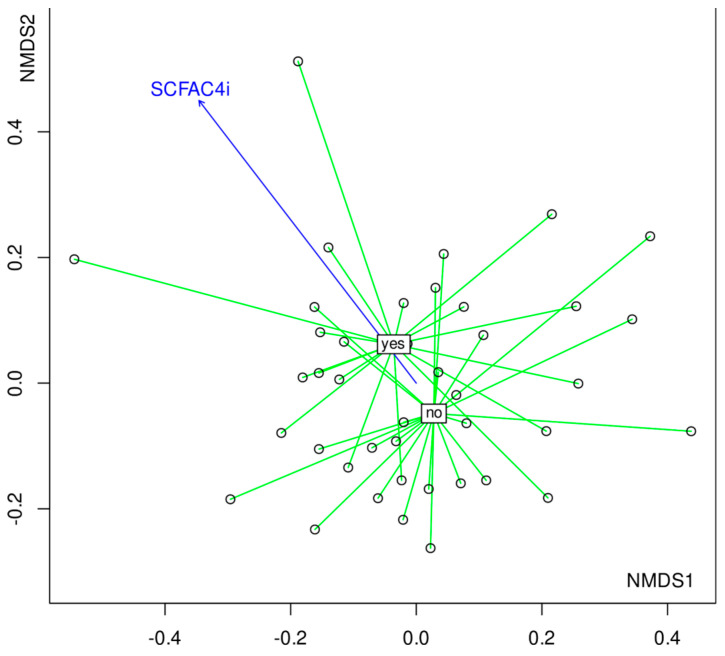
Figure 5.
NMDS plot of bacterial communities where samples are grouped into two significantly different groups—presence/absence of gastrointestinal complaints with the arrow representing increasing concentration of isobutyric acid in the stool. Yes—the presence of gastro-intestinal symptoms; no—the lack of gastro-intestinal symptoms. The blue arrow represents direction of increasing concentration of SCFAC4i.

