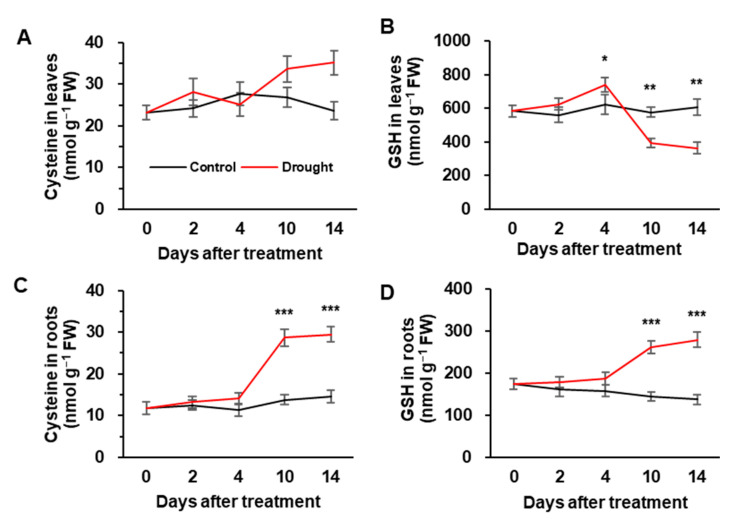
Figure 3.
Changes in concentration of cysteine (A,C) and glutathione (B,D) in leaves (A,B) and roots (C,D) in well-watered (control) or drought-stressed plants for 14 days. The black and red lines indicate control and drought stress, respectively. Data are represented as means ± S.E. for n = 4. Asterisks indicate a significant difference between well-watered and drought-stressed plants: * p < 0.05, ** p < 0.01, *** p < 0.001.

