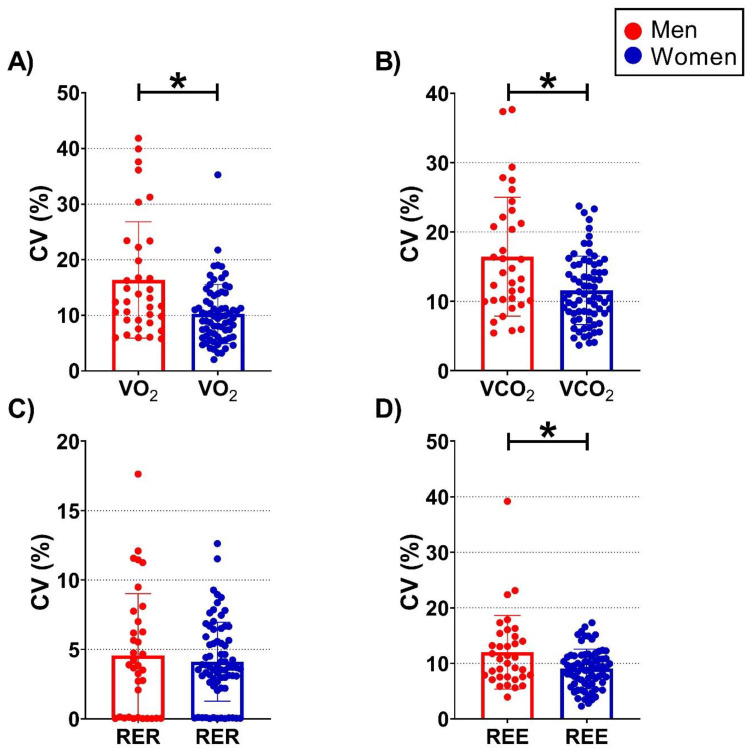
Figure 2.
Column plots for each coefficient of variation (CV, expressed as a percentage) of the data separated by men (red circles) and women (blue circles). Results are presented as mean and standard deviation, and all data points (i.e., individual values). CV were calculated for each individual and parameter, i.e., for the volume of oxygen consumption (VO2; Panel (A)), for the volume of carbon dioxide production (VCO2; Panel (B)), for the respiratory exchange ratio (RER; Panel (C)), and for the resting metabolic rate (RMR; i.e., resting energy expenditure [REE] estimated using the equation proposed by Weir [30] and assuming no urinary nitrogen excretion; Panel (D)). * represents p-values < 0.05 derived from analysis of covariance (ANCOVA) to examine between sex (i.e., men vs. women) adjusted mean differences while taking participants’ age into account as a confounder (i.e., ANCOVA models adjusted for age). N = 35 and 72 for men and women, respectively.

