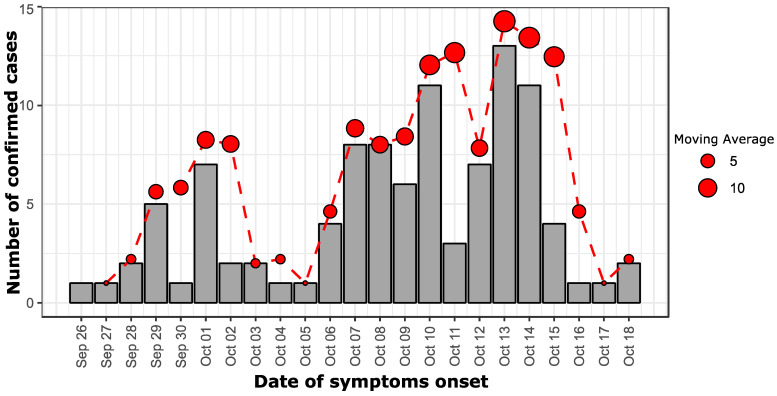
Figure 1.
An epidemiological curve showing the number of confirmed dengue cases during this outbreak investigation according to the date of symptoms onset; a dashed red curve shows the moving average of confirmed dengue cases per 2 days. The size of the dot is proportional to the value of the moving average.

