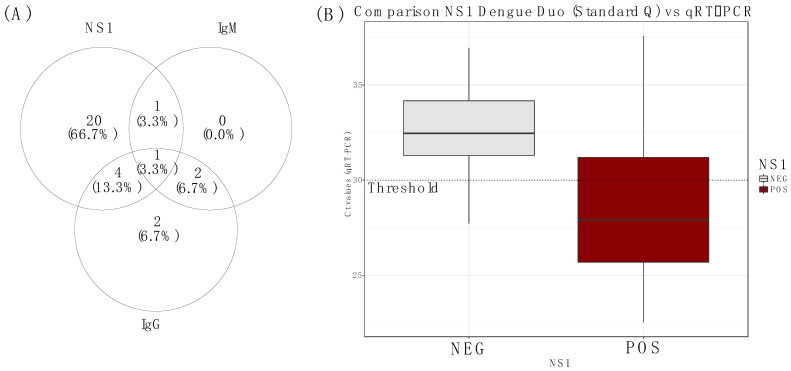
Figure 2.
(A) Venn diagram showing repartition of Standard Q NS1/IgM/IgG positive test results from the field; the number of samples positives DENV according to the targeted analyte (NS1,IgM and IgG), (B) Box plot showing a comparison of the median Ct values of Standard Q DENV NS1/IgM/IgG RDT on NS1-positive and NS1-negative samples.

