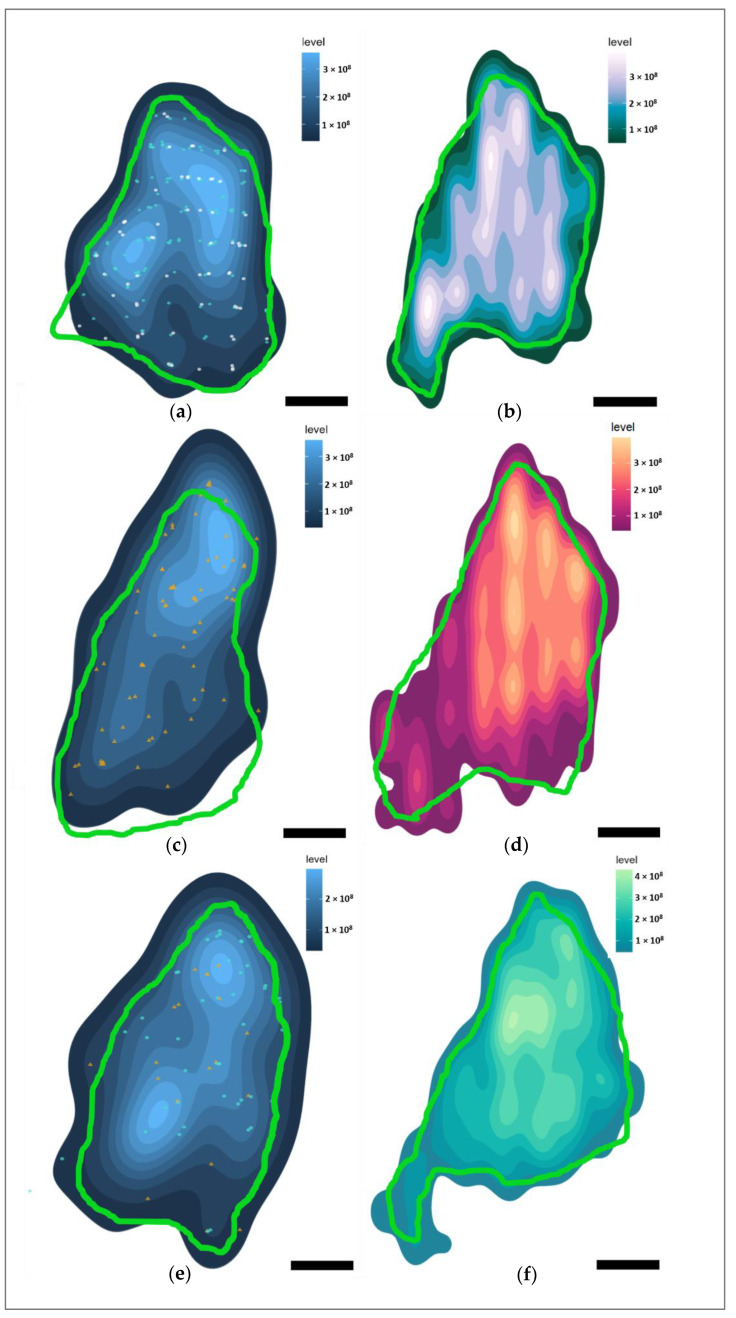
Figure 9.
Heatmaps of immunohistochemical marker distributions in the left VCN of Marine 0142 in the coronal plane (caudal perspective). In green—the average contour surrounding the putative VCN area from every 20th serial section. Lighter colors of the heatmaps represent a higher marker density. Scale bar: 2 mm. (a) Heatmap display total Aβ-containing neurons, regardless of immunoreactivity type. Turquoise points—neurons with nuclear immunoreactivity. White points—neurons with simultaneous cytoplasmic and nuclear immunoreactivity. (b) Heatmap of pNFP-ir axons. (c) Heatmap of all fibronectin-ir neurons. Orange points—neurons with cytoplasmic immunoreactivity pattern. (d) Heatmap of GFAP-ir astrocytes. (e) Heatmap of all TDP-43-ir neurons. Points as in (a,c). (f) Heatmap of Iba-1-ir microglia.

