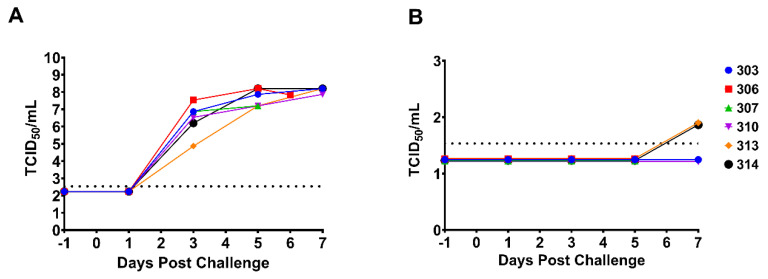
Figure 5.
Viral titers in blood and OP swabs. (A) The log transformed viral titers (TCID50/mL) of ASFV-MNG19 in EDTA blood collected on −1, 1, 3, 5, and 7 DPC. All samples were run in triplicate. The datapoints represent the calculated titers using the Spearman–Karber method. The dashed line represents the limit of detection for the assay. Datapoints for individual pigs are represented. The single data point at 6 DPC represents samples collected from pig #306 that was found dead. (B) The log transformed viral titers (TCID50/mL) of ASFV-MNG19 in OP swabs collected on −1, 1, 3, 5, and 7 DPC. All samples were run in triplicate. The datapoints represent the calculated titers using the Spearman–Karber method. The dashed line represents the limit of detection for the assay. Datapoints for individual pigs are represented.

