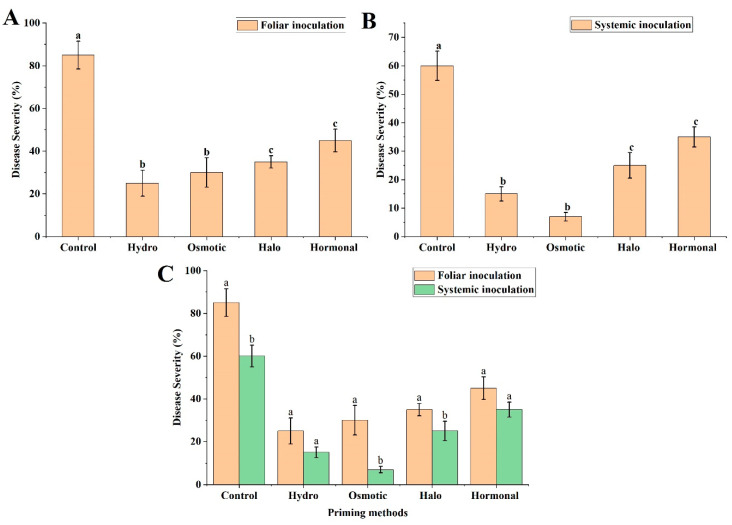
Figure 4.
Disease severity analysis of wheat plants in response to hydropriming, osmotic priming, halopriming, and hormonal priming. (A) Disease severity analysis after foliar inoculation of A. niger. (B) Disease severity analysis after systemic inoculation of A. niger. (C) Disease severity comparison between foliar and systemic inoculation. The mean values with different letter(s) indicate significant differences at p ≤ 0.05. Vertical bars represent standard deviation of means (n = 3).

