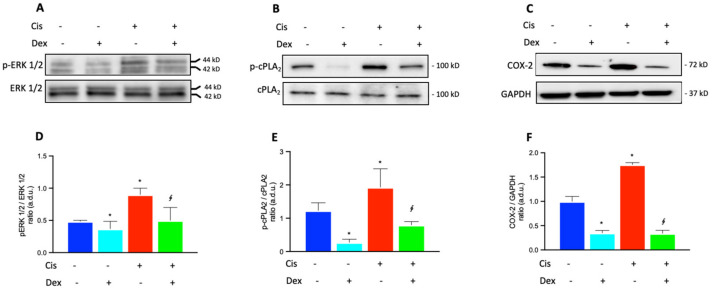
Figure 3.
Immunoblot analysis was performed using specific antibodies against p-ERK 1/2 and total ERK 1/2 (A), activated (phosphorylated, p-cPLA2) and total cPLA2 (B), and COX-2 (C) proteins. The blots were probed with anti-GAPDH (reference) antibody to verify the equal loading of 30 μg protein per lane. Image J software Version 1.52a, NIH, Bethesda, MD, USA). was used to carry out a densitometric analysis of the immunoblots, indicating protein quantification of each band (in arbitrary densitometry units, a.d.u.). Quantitative analysis of western blots for the phosphorylation rate of ERK 1/2 (ratio of p-ERK 1/2/ERK 1/2 in (D)) and cPLA2 (ratio of p-cPLA2/cPLA2 in (E)) are indicated. Quantitative analysis of western blots for COX-2 protein was normalized to GAPDH (F). (D–F): each treatment is represented by a different color: control cells are blue, dexamethasone-treated cells are light blue, cisplatin-treated cells are red and cells treated with cisplatin plus dexamethasone are green. The data are representative of three independent experiments with four parallel samples for each group in each experiment and are expressed as mean ± SD. * p < 0.05 vs. cells without treatment; ∮ p < 0.05 vs. cells treated with cisplatin. The non-parametric Mann-Whitney test was used for pairwise comparisons.

