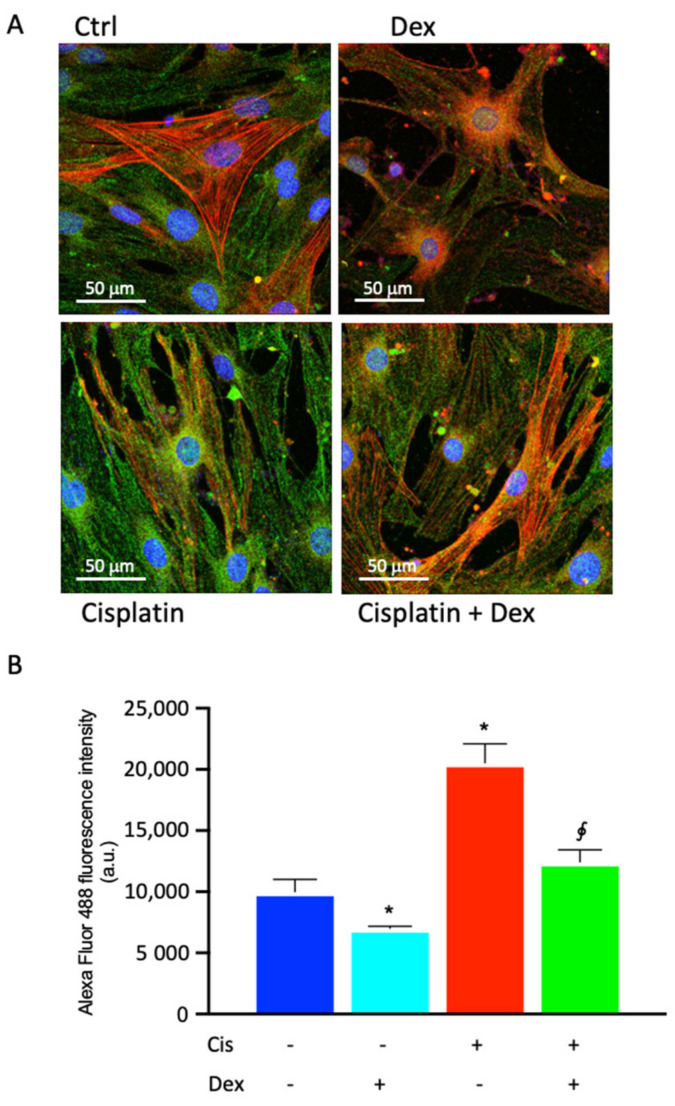
Figure 4.
Photomicrographs of COX-2 immunostaining (A) of BCP cultures in basal medium, without any treatment (control cells, Ctrl) or in medium containing 30 µM cisplatin in the absence or in the presence of 10 nM dexamethasone (Dex) for 48 h. (A) Representative images of immunocytochemical staining for COX-2 (Alexa Fluor 488, green) and alpha smooth muscle actin (α-SMA, Alexa Fluor 546, red) are shown. Blue fluorescence indicates DAPI staining of cell nuclei. Magnification: 40×; Scale bars: 50 μm. (B) Quantitative analysis of COX-2 emission intensity (a.u.). In panel (B), each treatment is represented by a different color: control cells are blue, dexamethasone-treated cells are light blue, cisplatin-treated cells are red and cells treated with cisplatin plus dexamethasone are green. The data are representative of three independent experiments with three parallel samples for each group in each experiment and are expressed as mean ± SD. * p < 0.05 vs. cells without treatment; ∮ p < 0.05 vs. cells treated with cisplatin. The non-parametric Mann-Whitney test was used for pairwise comparisons.

