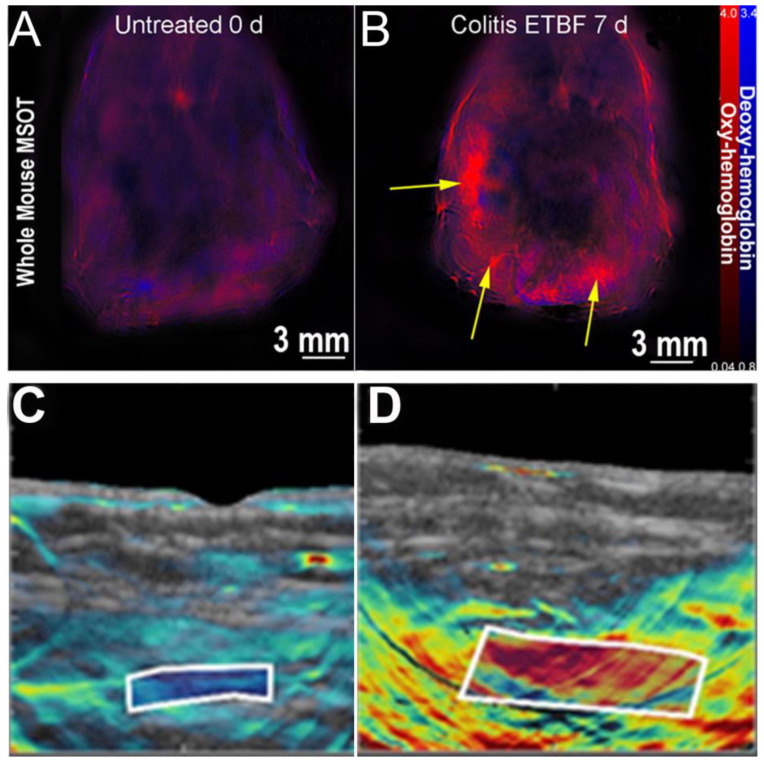
Figure 2.
MSOT can visualize colitis (A,B) and Crohn’s disease (C,D) by utilizing differential levels of oxy- and deoxyhemoglobin. (A) Control murine model with no detectable areas of colitis. (B) Murine model treated with enterotoxigenic Bacteroides fragilis, resulting in visually concentrated areas of colitis (yellow arrows). (C) Intestinal wall of a patient in remission from Crohn’s disease, showing previous inflammation seen as deoxyhemoglobin in the white box. (D) Intestinal wall of a patient with active Crohn’s disease, showing inflammation seen as oxy-hemoglobin in the white box. Panels A and B are adapted with permission from [47]. Panels C and D adapted with permission from [86].

