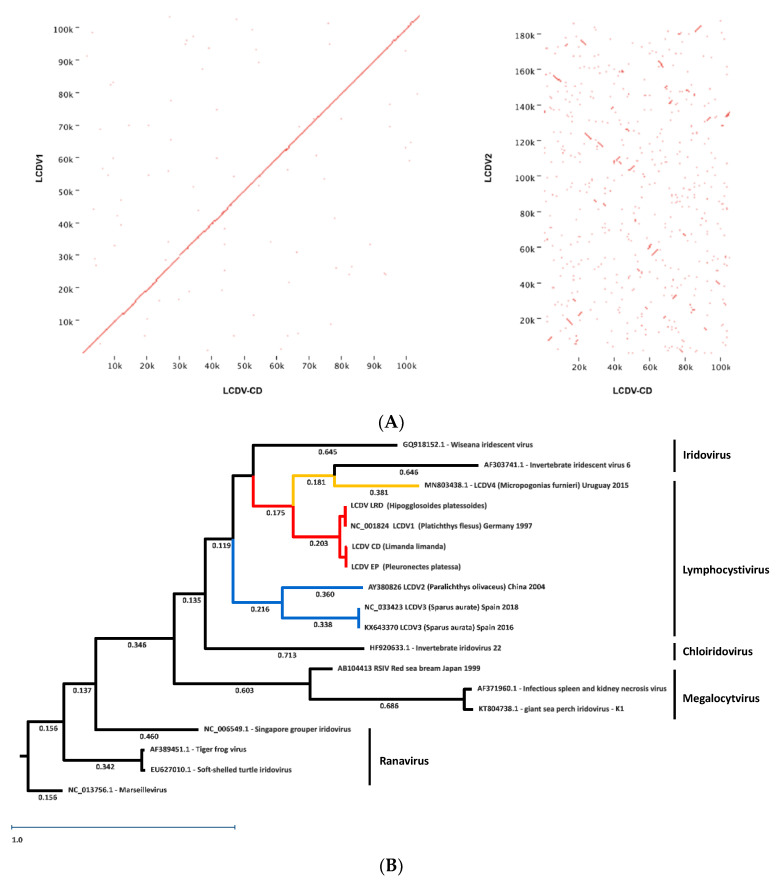
Figure 3.
(A) Genomic dot plot of LCDV genomes. The left figure shows the comparison of the genomic sequences of LCDV-CD with LCDV1, the right figure shows the comparison of LCDV-CD with LCDV2. (B) RAxML maximum likelihood tree (1000 bootstraps) of full genome Iridoviridae sequences. Numbers depict posterior probability values. The bootstrap values are given in Figure S2. Choice of genomes for Betairidoviridae genera Iridovirus and Chlroiridovirus and Alphairidoviridae genera Ranavirus and non-Iridoviridae outgroup nucleocytoplasmic large DNA viruses Marseillevirus, according to [23]. LCDV1-4 are highlighted in red and orange; LCDV2-3 in blue.

