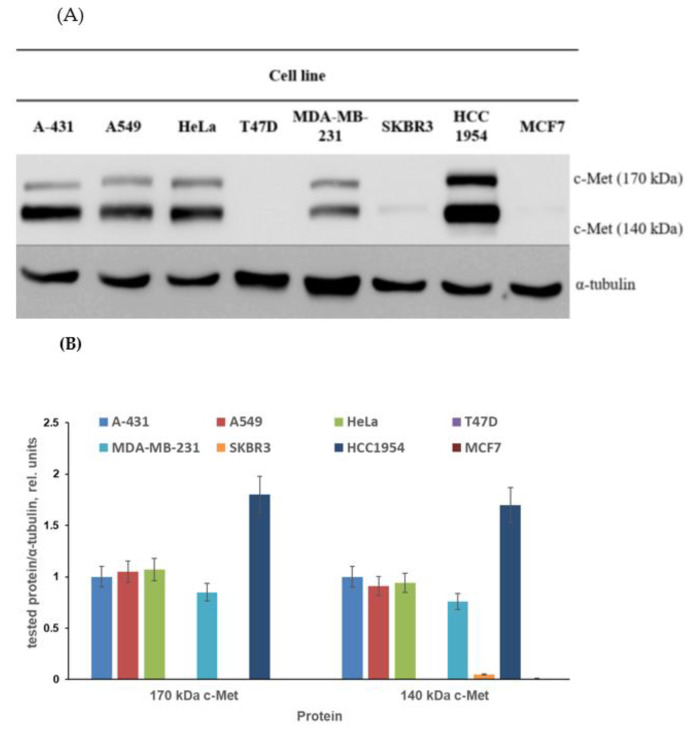
Figure 3.
The c-Met expression level in selected cell lines. (A) Representative immunoblotting images; (B) densitometry for immunoblotting data (n = 3) was carried out using ImageJ software (Wayne Rasband, NIH) with the protocol provided by The University of Queensland and the recommendations from the work [69].

