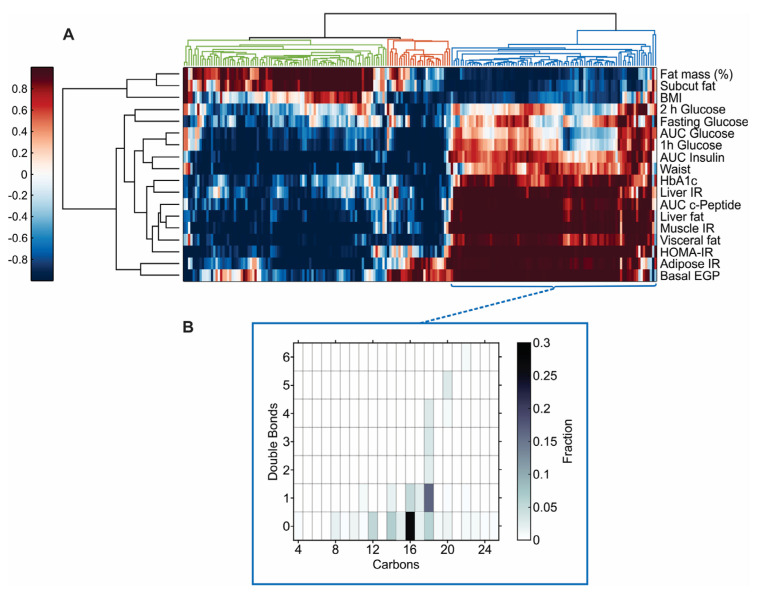
Figure 2.
Omics patterns of plasma lipidomics and metabolomics in individuals living with obesity. (A) Hierarchical clustering of metabolic phenotypes by plasma lipidomics and metabolomics. (B) Chain length (number of carbons) and number of double bonds in the TAGs represented in the blue cluster. In panel A, the clinical variables are shown in the rows with the metabolomics and lipidomics variables in the columns. The H = (1 − p)sign(R) value is shown as a heatmap with the color indicating the significance and direction of the correlation (Spearman) (i.e., red positive, blue negative and the darker the color the more significant p Value). The variables are clustered firstly according to the clinical variables (rows) with the hierarchical cluster tree shown as a dendrogram on the left. The p-value data in the columns (metabolomic and lipidomic variables) were then hierarchically clustered with the dendrogram shown at the top of the heatmap. In panel B, the color indicates the fraction of the total number of fatty acids (n = 207 FAs). Complete data were available for all variables other than the abdominal MRI data (n = 59) and AUC of insulin and c-peptide (n = 57 and n = 59, respectively).

