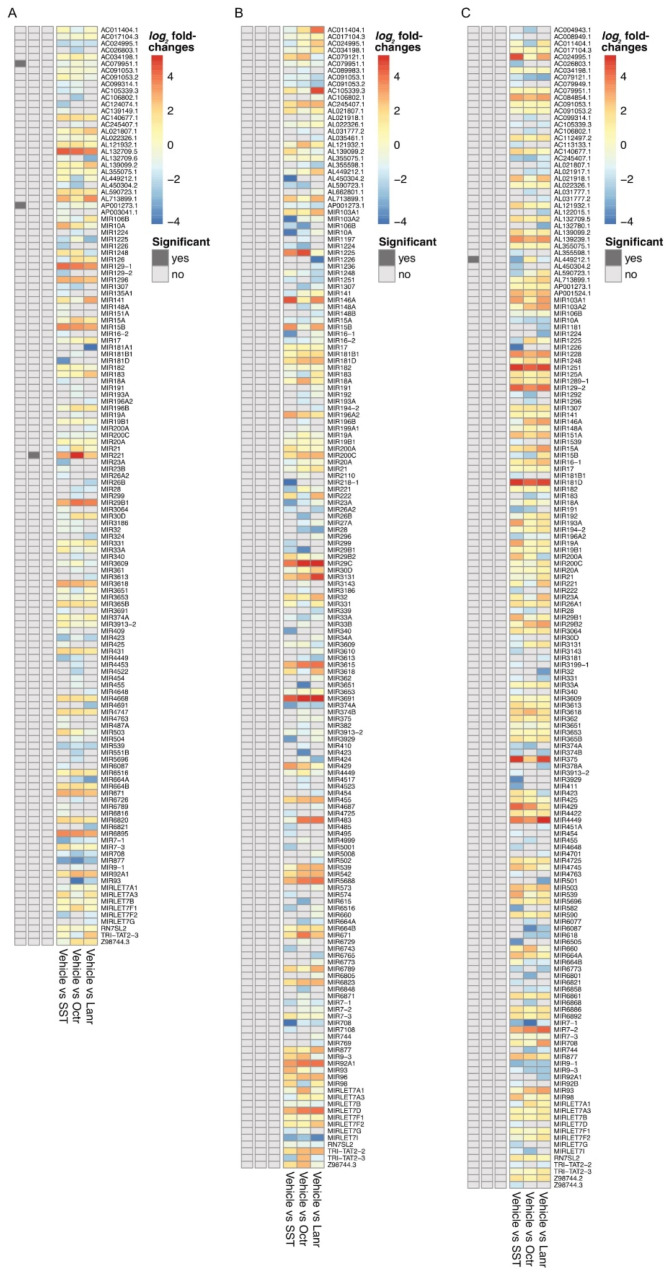
Figure 4.
miRNA sequencing in BON (A), QGP (B), or NT-3 (C) cells treated with either vehicle, SST, OCT, or LAN. The heatmaps show log2 fold changes as estimated by DESeq2. Values above 0 (orange/red colors) denote miRNAs upregulated in the vehicle (no treatment) group compared to the treatment group. In contrast, values below 0 (blue colors) represent those upregulated miRNAs in the treatment group. Grey cells indicate that the miRNA was not found (missing values). The left columns show p-values below 0.1 (dark grey, considered significant) or above 0.1 (light grey, considered non-significant).

