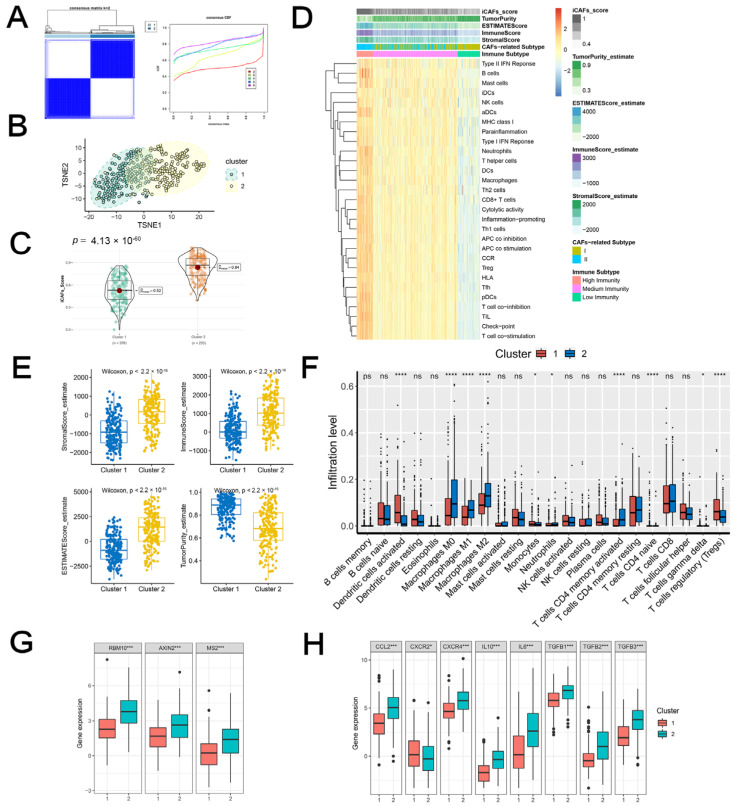
Figure 2.
iCAF-related subtypes had distinct immunogenomic patterns: (A) TCGA-BLCA was classified into two molecular subtypes. (B) The discrimination between the two subtypes was visualized by t-SNE. (C) Cluster 2 was featured with a high iCAF signature score. (D) Heatmap demonstrated three immunity subtypes with diverse iCAF-related subtypes, ESTIMATE score, and iCAF signature score. (E) The distribution of stromal, immune, ESTIMATE score, tumor purity, and iCAF signature between two subtypes. (F) The infiltration abundances of 22 immune cells between two subtypes. The expression levels of TEX signature genes (G) and M2 macrophage polarization factors (H) between two subtypes. Ns: Non-Significant; * p < 0.05; *** p < 0.001; **** p < 0.0001.

