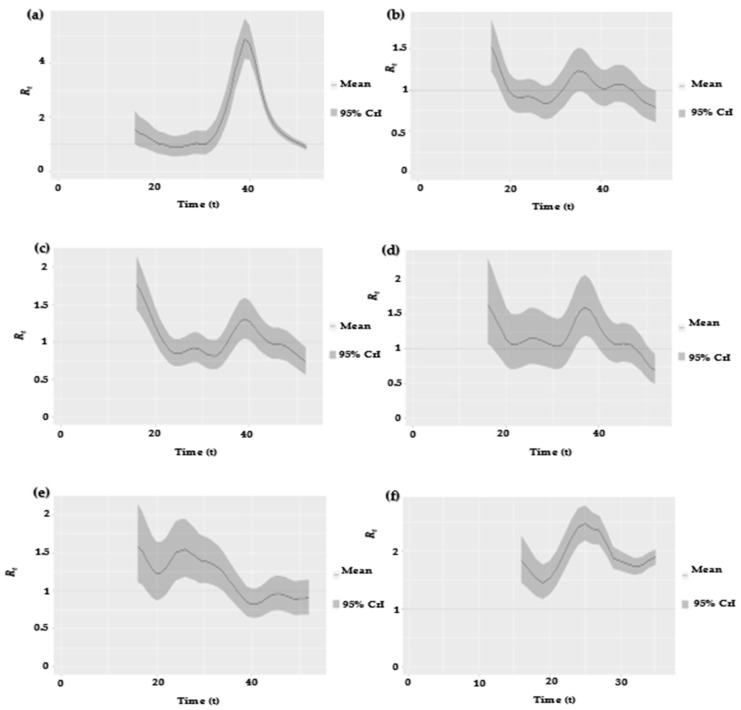
Figure 2.
Estimated Reff series for the data from 1 January 2017 to 27 August 2022, represented by panels (a–f) using the serial interval from [25]. The solid line denotes the estimated mean, and the shaded gray area represents the 95% credible interval (CrI). The horizontal dashed line marks the level of Reff = 1. Note that = Reff.

