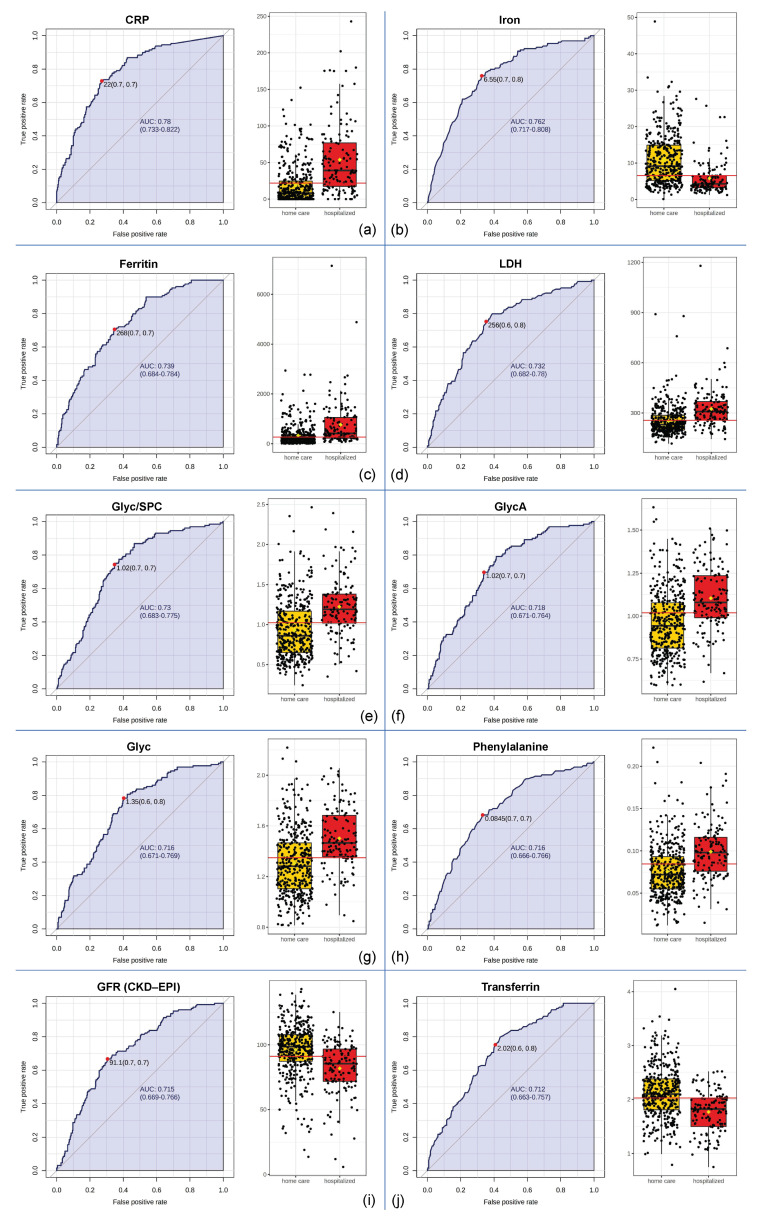
Figure 6.
Top ten parameters established from univariate biomarker analysis for hospitalization. For each biomarker, a comparison of the individual values of the respective parameters is shown on the right, and receiver operating characteristic (ROC) curves are found on the left. ROC curves illustrate the number of true positives and false positives for each possible threshold, and the trade-off of these values is quantified in the area under the curve (AUC). An AUC of 0.5 implies a random distribution with no association of the parameter with, in this case, hospitalization, whereas an AUC of 1 implies a perfect predictive model. The parameters are sorted by AUC, with the top parameter can be found under (a) and the AUC decreases steadily until (j). The red dots on the curves indicate the ideal classification thresholds. For example, an iron threshold of 6.55 (subfigure (b)) can correctly identify 70% of the hospitalized COVID-19 patients in our cohort and can correctly classify 80% of the patients who were not admitted to the hospital.

