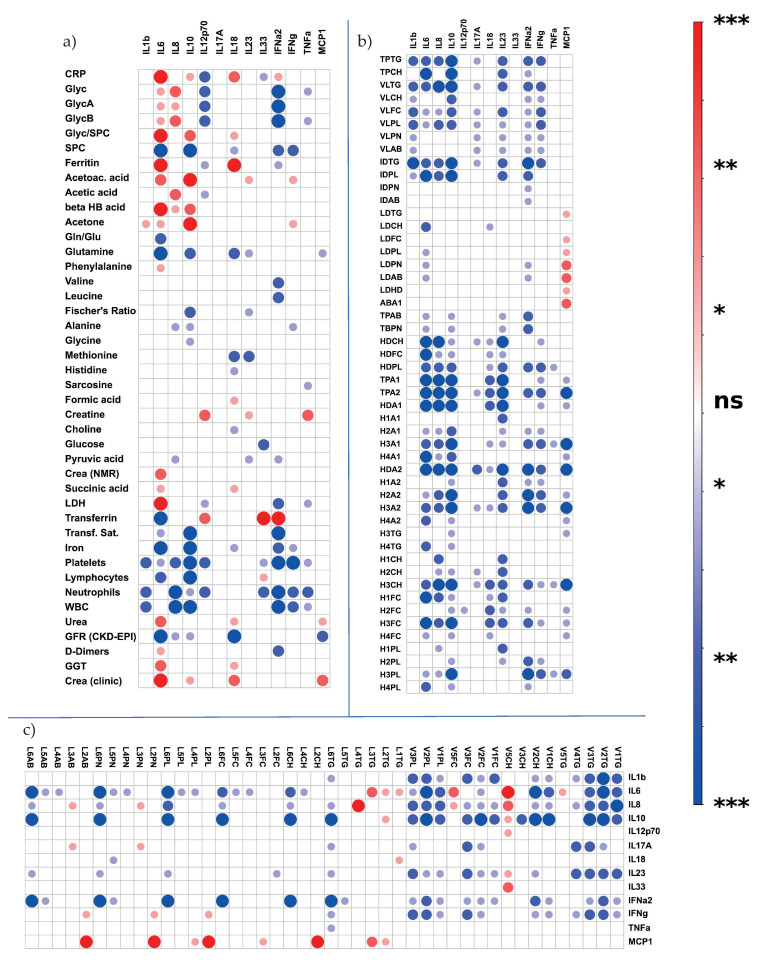
Figure 7.
Analysis of correlations between different NMR and clinical parameters and cytokines. The different significance levels are color-coded (see legend on the right). Red dots indicate a positive correlation, and blue dots indicate a negative correlation. One asterisk implies a p-value of <0.05, two asterisks are equivalent to a p-value of <0.01 and three asterisks indicate a p-value of <0.001. On the left side, under (a), the figure shows the correlations of the measured cytokines with acute phase proteins, Glyc and SPC, ketone bodies, amino acids and other parameters from B.I. QUANT-PS™, as well as parameters from the clinical laboratory. On the right, under (b), the figure shows the correlations of the cytokines with the main parameters from the lipid fraction, as well as with all the markers from the HDL subfraction. The correlations of cytokines with the remaining markers from the other lipid subfractions are displayed under (c). A list of used abbreviations can be found in the Supplementary Materials (Table S9).

