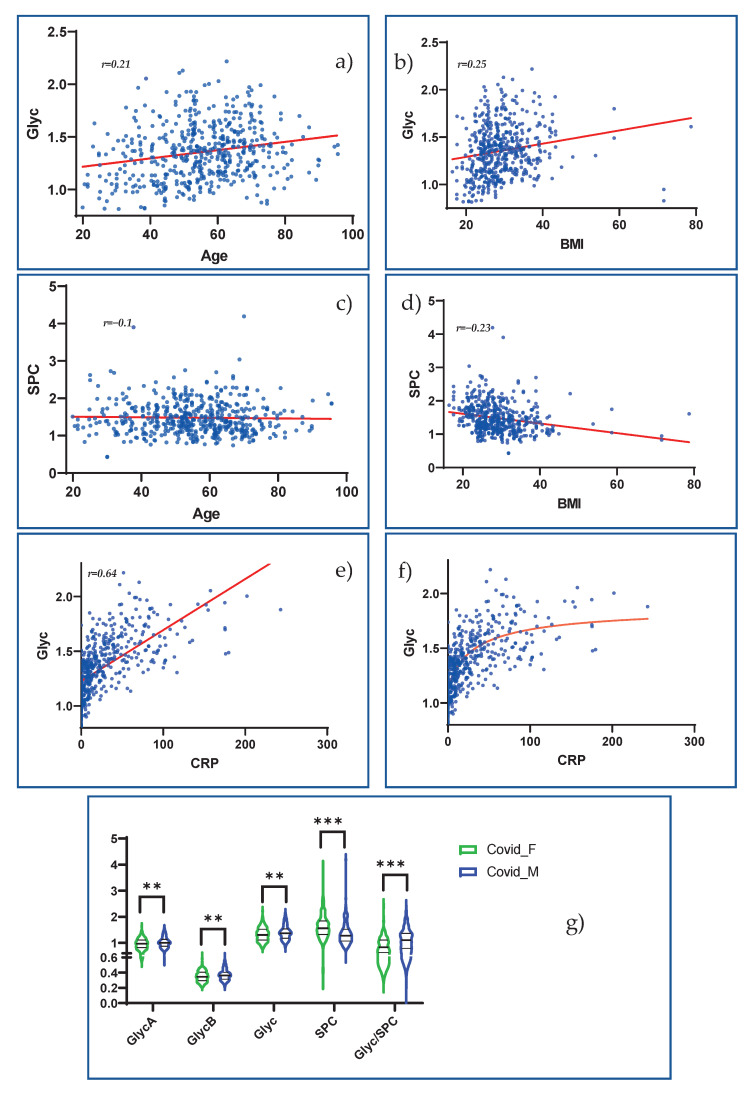
Figure 8.
Relationship of 1H-NMR inflammation markers Glyc (sum of glycoprotein A and B) and SPC with possible confounders of age (a,c) and BMI (b,d). In subfigures (e,f), we examined the correlation of Glyc with CRP. The red line, which represents the trend line in subfigures (a–f), represents a linear correlation in subfigure (e) and a nonlinear correlation in subfigure (f). Correlation coefficients (Pearson) are given in the upper left corner of the subfigures with an analysis of linear correlation. (g) A possible correlation also exists between Glyc and SPC with the respective sex. Asterisks describe the significance level of a sex-specific distinction (** = p ≤ 0.01, **** = p ≤ 0.0001).

