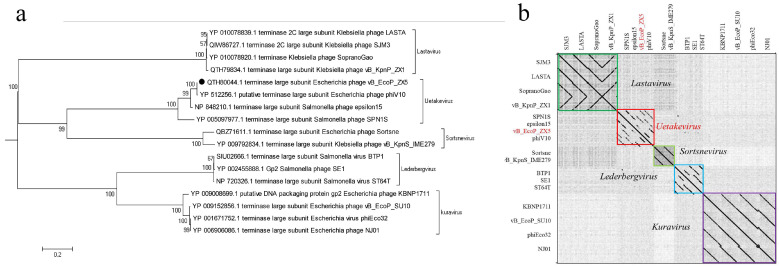
Figure 4.
Phylogenetic analysis of the phage vB_EcoP_ZX5. (a) Phylogenetic tree of the terminase large subunit of the phage vB_EcoP_ZX5. The scale bar represents a phylogenetic distance of 0.2, and the numbers at the nodes represent the percent bootstrap values. (b) Genomes dot plot analysis of the phage vB_EcoP_ZX5. Different genome clusters are marked with different colored boxes.

