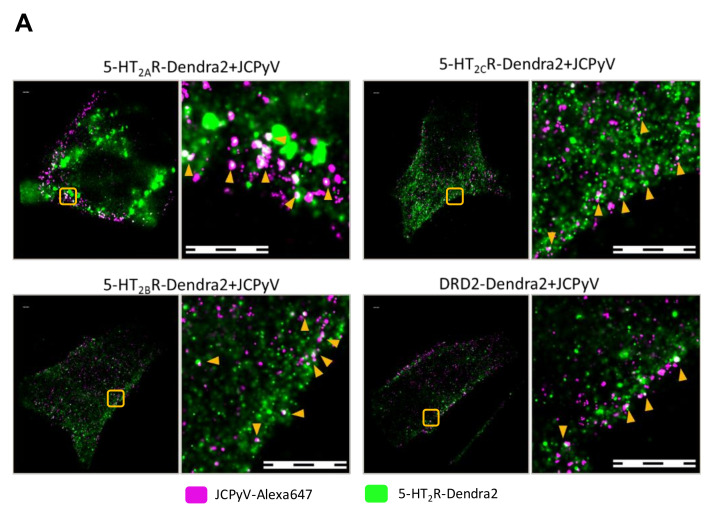
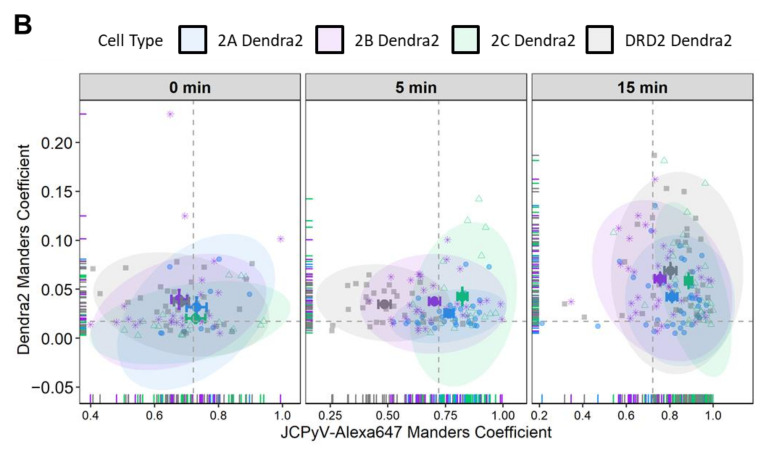
Figure 3.
FPALM analysis demonstrates JCPyV localization with 5-HT2R-Dendra2 and DRD2- Dendra2. (A) Representative widefield super resolution FPALM images of 5-HT2AR-Dendra2, 5-HT2BR- Dendra2, 5-HT2CR-Dendra2, and DRD2-Dendra2 at 5 min post infection (mpi). Scale bars = 1 µm. (B) Manders’ colocalization coefficients (MCC) demonstrated by scatter plot showing analysis for JCPyV-647 incubated with corresponding 5-HT2Rs-Dendra2 and DRD2-Dendra2 stable cells at 0, 5, and 15 mpi. Samples were excited using 561 nm and 638 nm lasers, and activated using a 405 nm laser, and imaged with a 60× 1.45NA TIRF objective. Normal distribution of the population determined by Shapiro Wilks test and Quantile-Quantile plot. Significance was determined using the pairwise Wilcox test and the Bonferroni method was used for the p-value adjustment. Fluorescence images were pre-processed, and the background signal was removed. MCCs were calculated after rendering molecules by convolving localizations with a normalized 50 nm circle. Cell areas were masked using an automatic algorithm. Populations represent at least 10 cells per time point and sample; representative of three independent replicates. Error bars = SEM.


