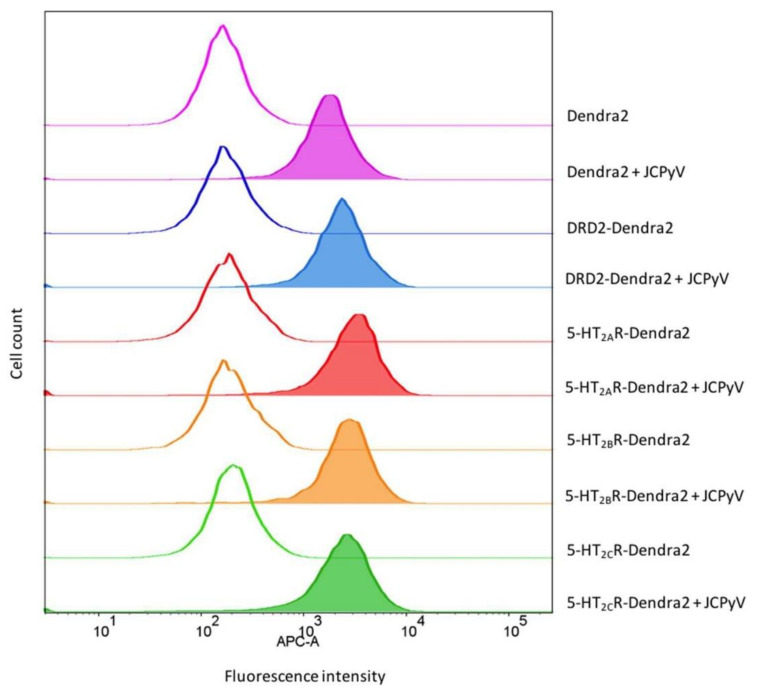
Figure 4.
JCPyV attachment is not enhanced in 5-HT2R-expressing cells. Indicated stable cell lines were incubated with JCPyV-647 (filled histograms) or mock-treated (open histograms) on ice for 1 h and analyzed by flow cytometry. Histograms represent a comparison of JCPyV-647 attachment to HEK293A cells stably expressing 5-HT2AR-Dendra2 (red), 5-HT2BR-Dendra2 (orange), 5-HT2CR-Dendra2 (green), DRD2-Dendra2 (blue), and Dendra2 (purple) proteins constructs. Histograms represent the mean fluorescence intensities for mock-treated (unfilled), or samples treated with JCPyV-647 (filled). Data are representative of 10,000 events for individual samples representative of 3 independent experiments. Data were analyzed using FlowJo software.

