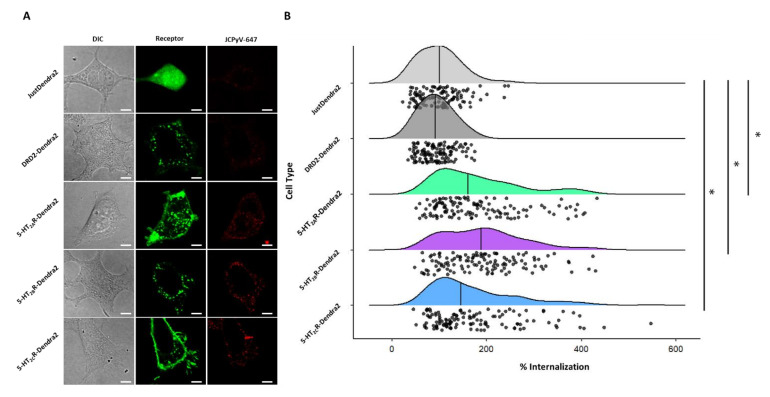
Figure 5.
JCPyV internalization significantly increases in 5-HT2R subtype-expressing stable cells. Cells stably expressing 5-HT2R subtypes were plated and infected with JCPyV-647 (MOI = 3 FFU/cell) on ice for synchronized virus attachment and further incubated at 37 °C for 1.5 h to allow for viral entry. After fixation, cells were visualized via confocal microscopy using a 60× objective lens. (A) Images demonstrate DIC (grey), Dendra2 expression (green), and JCPyV-647 (red) in individual samples. Using Image J, masks were drawn for Dendra2- expressing cells in individual samples and JCPyV internalization was quantified using the relative fluorescence intensity of JCPyV-647 within individual cells for at least 30 cells of each sample per replicate for 3 independent replicates. (B) Quantified data are shown as a raincloud plot with individual data points indicated in black and the distribution shown with the median indicated by a black line. The Wilcoxon Rank Sum Test was used to compare the percent internalization of each cell type. The percent internalization of 5-HT2AR-Dendra2, 5-HT2BR-Dendra2, and 5-HT2CR-Dendra2 subtypes was significantly different compared to DRD2-Dendra2 and JustDendra2. There was no significant difference between percent internalization of JCPyV between 5-HT2R subtypes. The symbol * signifies p < 0.01. Scale bars = 5 μm.

