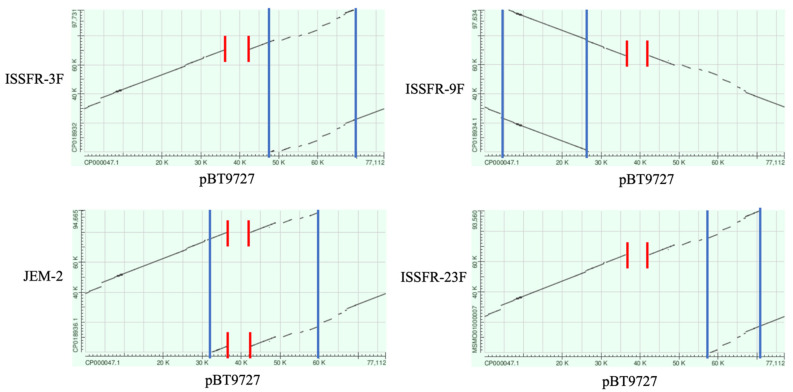
Figure 7.
Dot Plot representations (BLAST score ratio-based synteny plots) of alignments between B. thuringiensis serovar konkukian 97-27 plasmid pBT9727 (X-axis) and the ISS Bacillus strains (Y-axis, ISSFR-3F, ISSFR-9F, JEM-2 and ISSFR-23F from top left to bottom right, respectively). Each point on the figure represents an individual peptide in pBT9727 compared to the proteome of the ISS plasmids. Red lines indicate the region containing a hypothetical IS231 transposase in pBT9727 absent in the ISS Bacillus plasmids. Based on the sequences present in GeneBank, the plasmid regions between the Blu lines are duplicated regions in the ISS plasmids. The ISSFR-9F plasmid shows a reverse relative orientation compared with pBT9727. GeneBank accession numbers: B. thuringiensis serovar konkukian pBT9727 plasmid CP000047.1, 77112 bp. Bacillus ISSFR-3F plasmid CP018932, 97,731 bp. Bacillus ISSFR-9F plasmid CP018934.1, 97,634 bp. Bacillus JEM-2 plasmid CP018936.1, 94,665 bp. Bacillus ISSFR-23F plasmid MSMO01000007, 93,560 bp.

