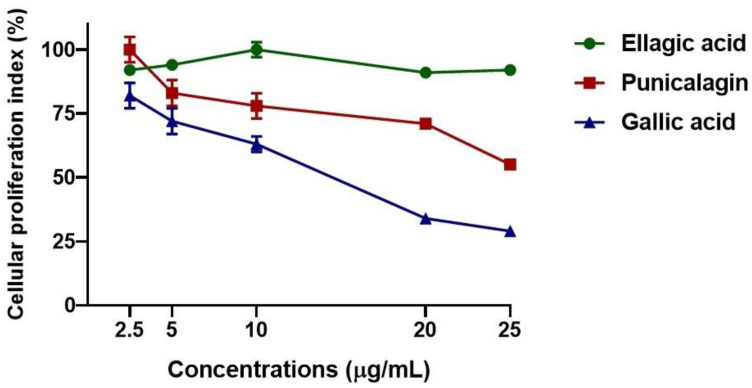
Figure 8.
Cytotoxicity assay. Vero cells were treated with different concentrations of punicalagin, ellagic acid, and gallic acid (25 µg/mL, 20 µg/mL, 10 µg/mL, 5 µg/mL and 2.5 µg/mL). The cells were collected 72 h post-treatment, and the cell viability was carried out as described in Section 2. The results are shown graphically as the proliferation index (%). The results presented are the means of triplicates ± SD.

