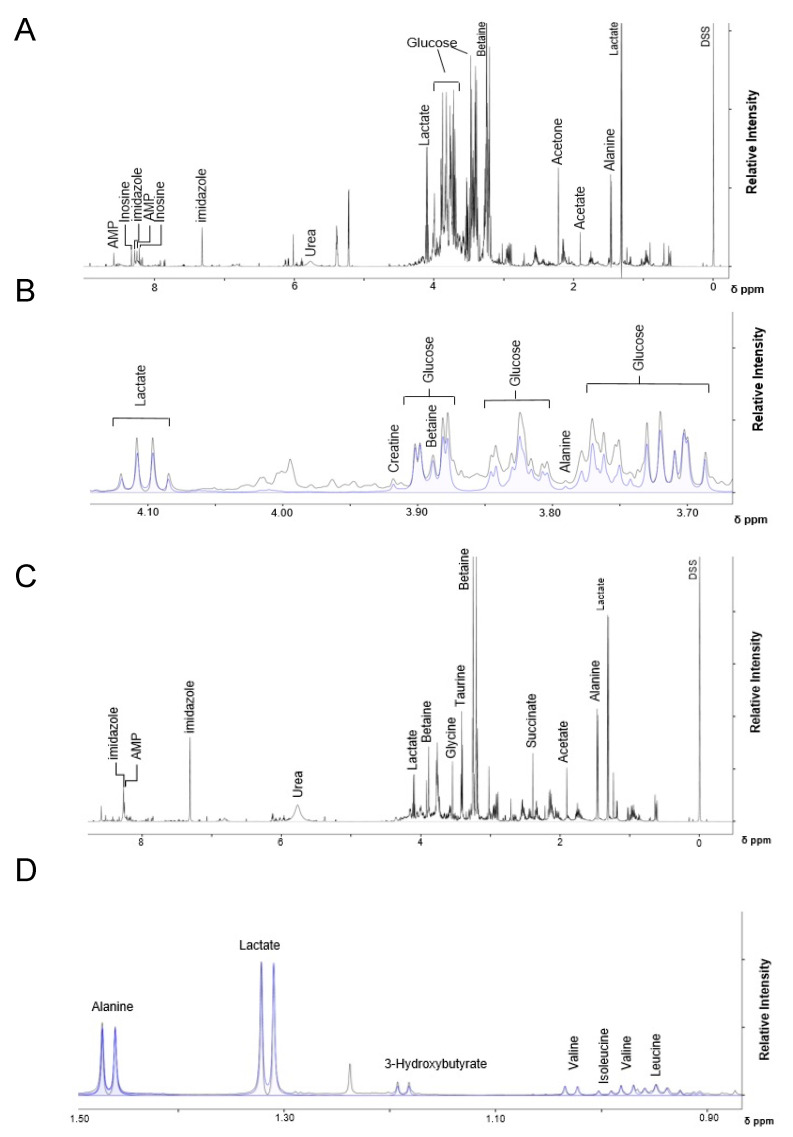
Figure 2.
Representative 1D-1H-NMR spectra of polar metabolites from control and ricin-treated mice livers. Spectra were recorded on a Bruker Avance III 600 MHz spectrometer. Chemical shift in ppm is denoted on the x-axis, and relative signal intensity is denoted on the y-axis. The 1D 1H-NMR spectra is shown in black, and the spectral peaks for labeled metabolites are shown in blue. (A) 0.0–8.0 ppm region of the 1D-1H-NMR spectra obtained from polar molecules extracted from control mice, and (B) expanded view of the 3.70–4.10 ppm region of the same spectrum in A. (C) 0.0–8.0 ppm region of the 1D-1H-NMR spectra from polar molecules extracted from overnight ricin-treated mice, and (D) expanded view of the 0.90–1.50 ppm region of the same spectrum in (C).

