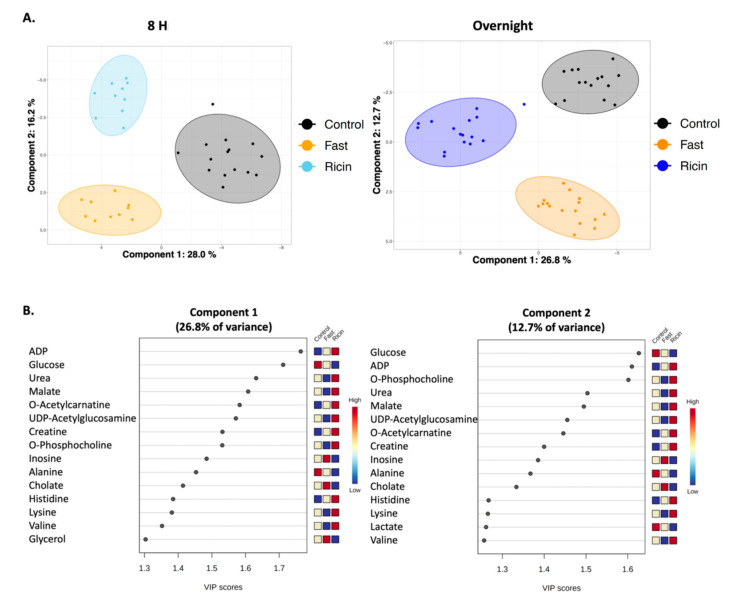
Figure 3.
Two dimensional PLS-DA showing differences among control, fasted, and ricin-treated groups. (A) Plots showing differences among the groups at 8 h and 18–23 h. Filled colored circles represent samples from individual mice, the shaded areas are 95% confidence limits. Validation statistics are as follows: 8 h graph: Q2 = 0.87 (component 2), R2 = 0.90 (component 2), permutation p < 5e−0 (n = 2000), and CER: 0.0 (component 2). Overnight graph: Q2 = 0.85 (component 2), R2 = 0.90 (component 2), permutation p < 5e−0 (n = 2000), and CER: 0.017 (component 2). (B) Metabolites of importance in components 1 and 2 of PLS-DA of overnight fasted vs. ricin treated mice. The metabolites contributing most to each component of the PLS-DA shown in A are ranked according to importance. A score >1.2 is considered significant. Relative metabolite levels for each group are indicated to the right of the VIP graph.

