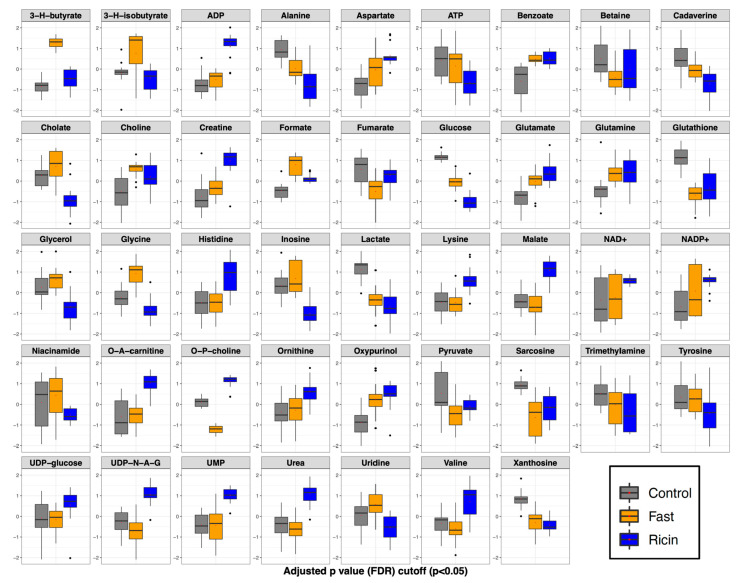
Figure 5.
ANOVA demonstrating significant metabolite changes among control, fasted, and ricin-treated mice. Box and whisker plots for metabolites with statistically significant differences by one-way ANOVA, with Tukey’s post hoc analysis. Metabolites are listed alphabetically. The vertical axis is the metabolite concentration, log transformed and autoscaled (mean-centered and divided by the standard deviation of each variable). The horizontal bar within each box represents the sample median, the box represents the range from quartiles 1 to 3. The whiskers represent 1.5 times the IQR (interquartile range). The black dots represent outliers between 1.5 and 3 X IQR.

