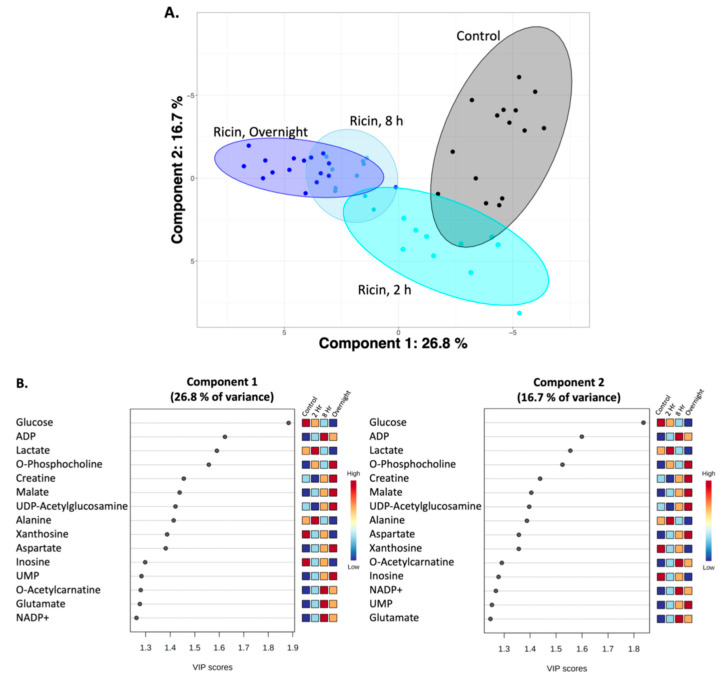
Figure 6.
PLS-DA plot showing progression of metabolic changes with time in ricin-treated mice relative to the control group, as assessed by1H-NMR metabolomics. (A) PLS-DA plots. Validation metrics of the PLS-DA model included satisfactory R2 and Q2 (0.8) values (Component 5), a significant permutation test p value < 0.001 (n = 1000), a classification error rate (CER) value of 0.05 (Component 5) and acceptable ROC curve parameter. (B) Metabolites which drive the separation of components 1 and 2. The metabolites contributing most to the separation along each component of the PLS-DA shown in A are ranked according to importance. A score >1.2 is considered significant. Relative metabolite levels for each time point are indicated to the right of each VIP graph.

