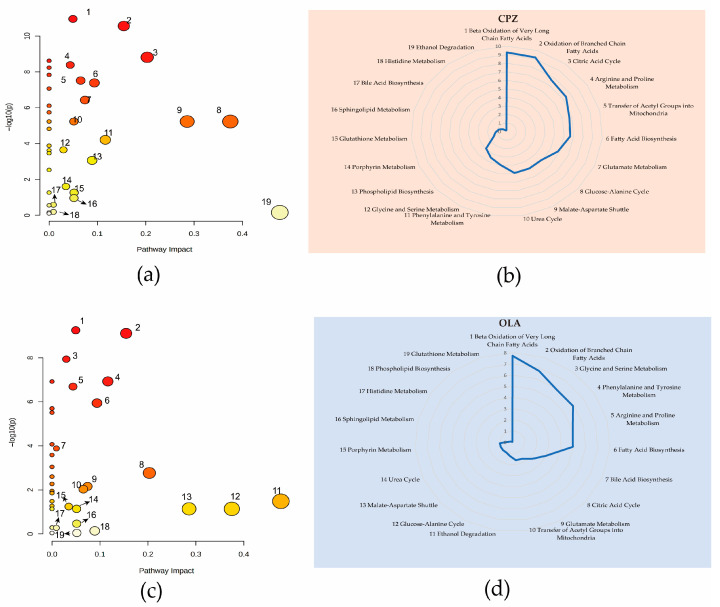
Figure 2.
QEA results of fatal-intoxication models due to CPZ (a,b) and OLA (c,d) at high dose. Nineteen metabolic pathways with a PI score >0 in the CPZ animal model (a) and their associated logarithmic-transformed p-values (b). Nineteen metabolic pathways with a PI score >0 in the OLA animal model (c) and their associated logarithmic-transformed p-values (d). n = 10. Notes: Pathways represented by bubbles in a and c with a PI score >0 are listed by numbers according to their p (log-p) values. Radar charts were utilized to show the names of metabolic pathways, and their significance is marked with the same numbers as those in bubble plots. Arrows in bubble plots are used to reduce the crowding of numeric markers.

