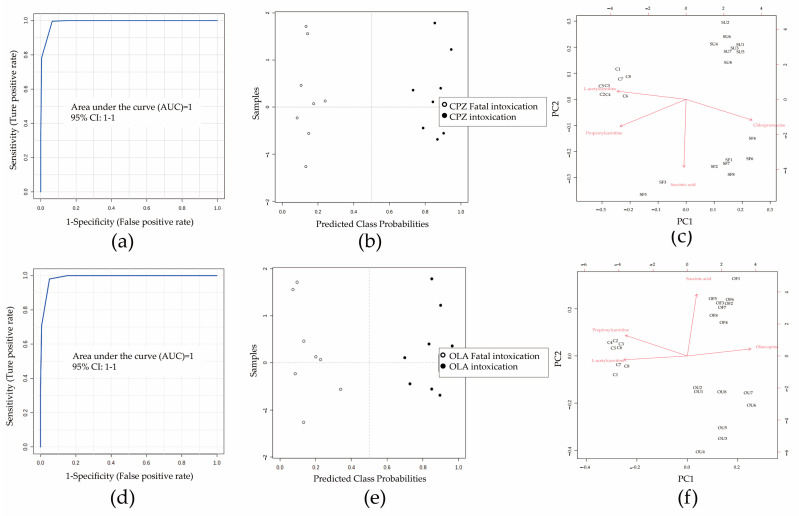
Figure 5.
Contributions of three potential metabolites and antipsychotics in different life states at a low dose. ROC curves (a,d) and predicted class probabilities (b,e) show the differential performance between fatal intoxications and intoxications caused by CPZ (a,b; AUC: 1; 95%CI of AUC: 1–1) or OLA (d,e; AUC: 1; 95%CI of AUC: 1–1). PCA bi-plot showing scatters of samples (black font) from different life states based on three potential metabolites and antipsychotics (red font) profiles. Vector (red straight arrow) projections parallel to between groups show their discriminative power and arrows point in the direction of higher content. Further distinguishing of intoxication with fatal intoxications revealed that CPZ (c) or OLA (f) (red vectors) contributed less than succinic acid. n = 8, respectively. Abbreviations: SU: intoxications caused by CPZ at a low dose; SF: fatal intoxications caused by CPZ at a low dose; OU: intoxications caused by OLA at a low dose; OF: fatal intoxications caused by OLA at a low dose; C: controls.

