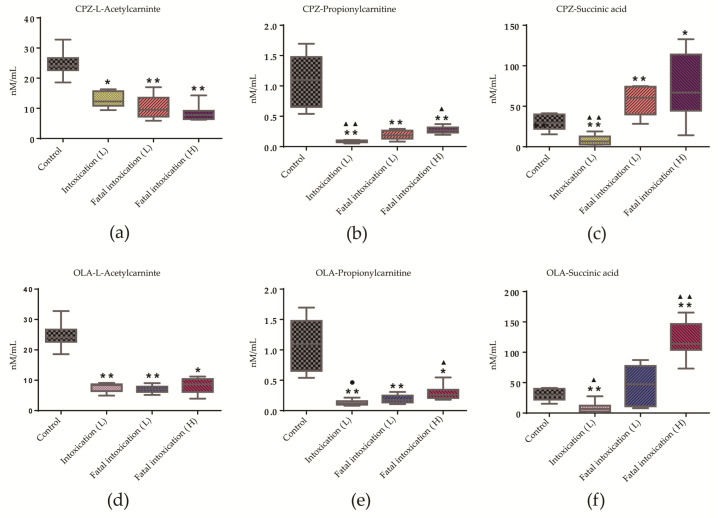
Figure 6.
Trends in levels of L-acetylcarnitine, succinic acid, and propionylcarnitine in intoxication and fatal-intoxication groups. (a–c) CPZ administration. (d–f) OLA administration. * p < 0.05, ** p < 0.01 compared with controls. ▲ p < 0.05, ▲▲ p < 0.01 compared with the fatal-intoxication (low dose) group; ● p = 0.055. Significance was determined by Student’s t-test or Mann–Whitney U-test. Box plots are expressed as means (horizontal lines), 10 to 90 percentile (boxes), and extent of data (whiskers). n = 8. Abbreviations in brackets: L: low dose; H: high dose.

