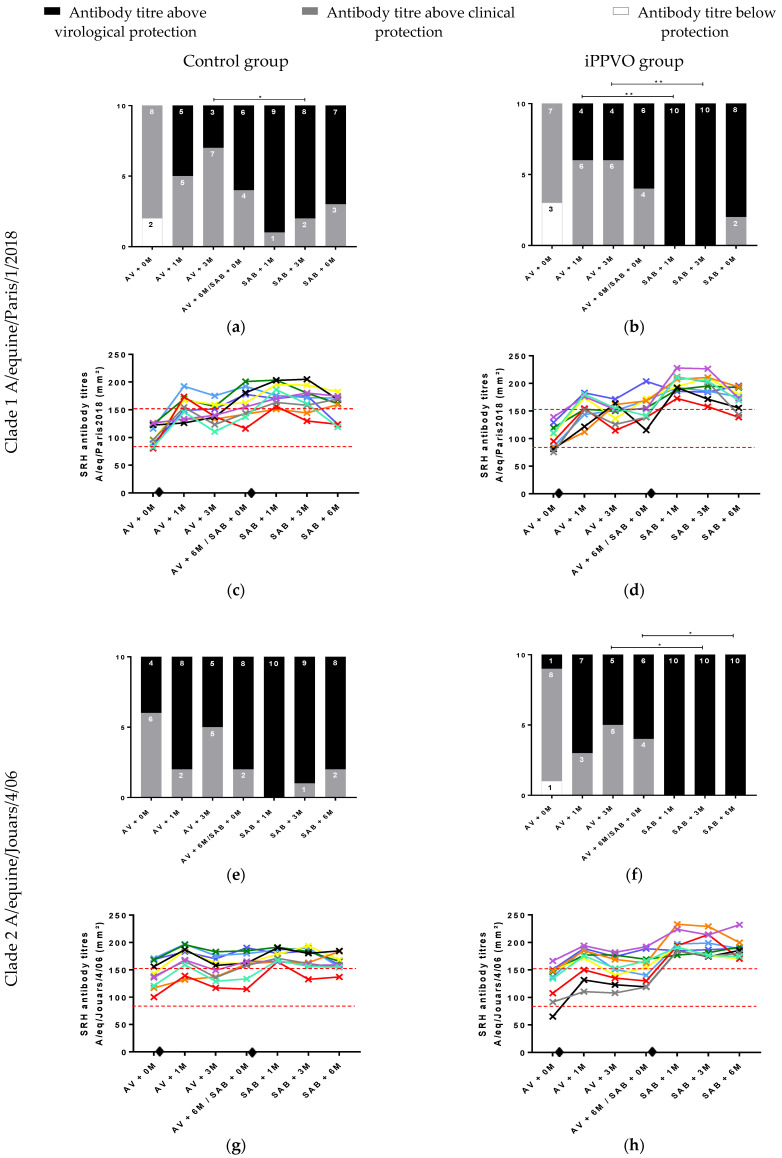
Figure 3.
Evolution of H3N8 antibody response to simple radial haemolysis (SRH) measured before and after annual vaccination (AV) and semi-annual vaccination (SAB) with or without iPPVO. Values are for sera isolated from blood samples that were collected for 1 year from AV to 6 months after SAB. Values correspond to sera isolated from blood samples collected in the control and iPPVO groups before AV, 1 and 3 months after AV; before the booster, 1, 3 and 6 months after the semi-annual booster (SAB). Cumulative histograms represent the distribution of the number of horses according to the different levels of protection (white: unprotected; grey: clinical protection and black: virological protection) for the different sampling points for horses in the control group (a) and horses in the iPPVO group (b) for A/equine/Paris/1/2018 strain and in the control group (e) and horses in the iPPVO group (f) for A/equine/Jouars/4/06 EIV strain. Each horse is represented with a specific colour in the different graphs (c, d, g and h). The different colours correspond to the SRH values of the horses in the control group (n = 10) (c) and iPPVO group (n = 10) (d) for A/equine/Paris/1/2018 strain and the SRH values of the horses in the control group (n = 10) (g) and iPPVO group (n = 10) (h) for A/equine/Jouars/4/06 EIV strain. The diamond represents the timing of the AV injection and the 6 month SAB injections with or without iPPVO. * and ** indicate significant difference (χ2 tests; p < 0.05 and 0.005, respectively) in the frequency of horses reaching the protection threshold between the control group and the iPPVO group. Only similar time points post immunisation were compared.

