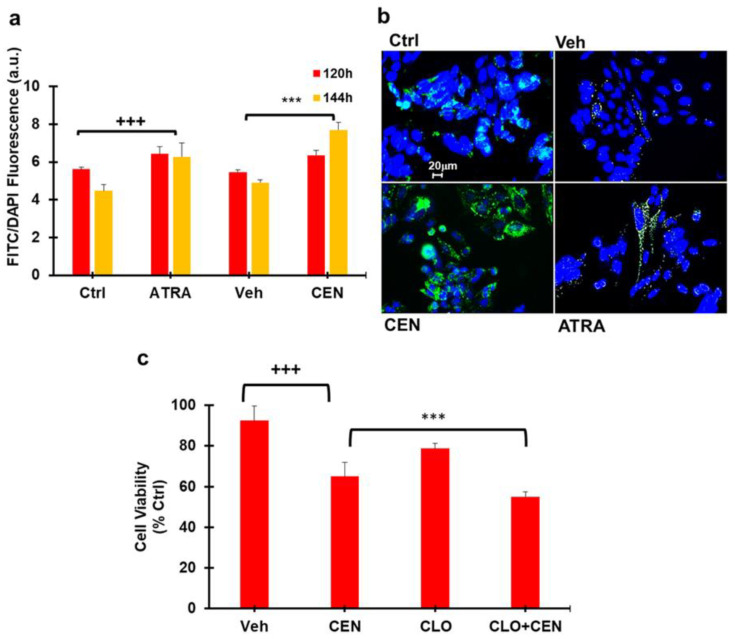
Figure 3.
CEN induces protective autophagy in SAOS400 cell lines. Panel (a): SAOS400 cells were treated for the indicated time with CEN (200 μg/mL) or ATRA (2 μM) used as a positive control. Cyto-ID staining was used to quantify intracellular autophagosomes and expressed as FITC/DAPI fluorescence, as described in the Materials and Methods Section. Panel (b): Micrographs of the representative fields of SAOS400 cells treated as described in (a) (400× magnification). Panel (c): Cells were treated with CEN (200 μg/mL) or pretreated with chloroquine (CLO; 10 μM) before incubation with CEN for 96 h. The Cristal Violet assay was used to assess cell viability at the end of incubation, as described. The bar graphs represent the mean ± SD, and symbols and linear bars indicate significance: *** p < 0.001 of SAOS400 vs. CLO and CEN mono treatments; +++ p < 0.001 CEN vs. cells treated with control nanoemulsions (Veh).

