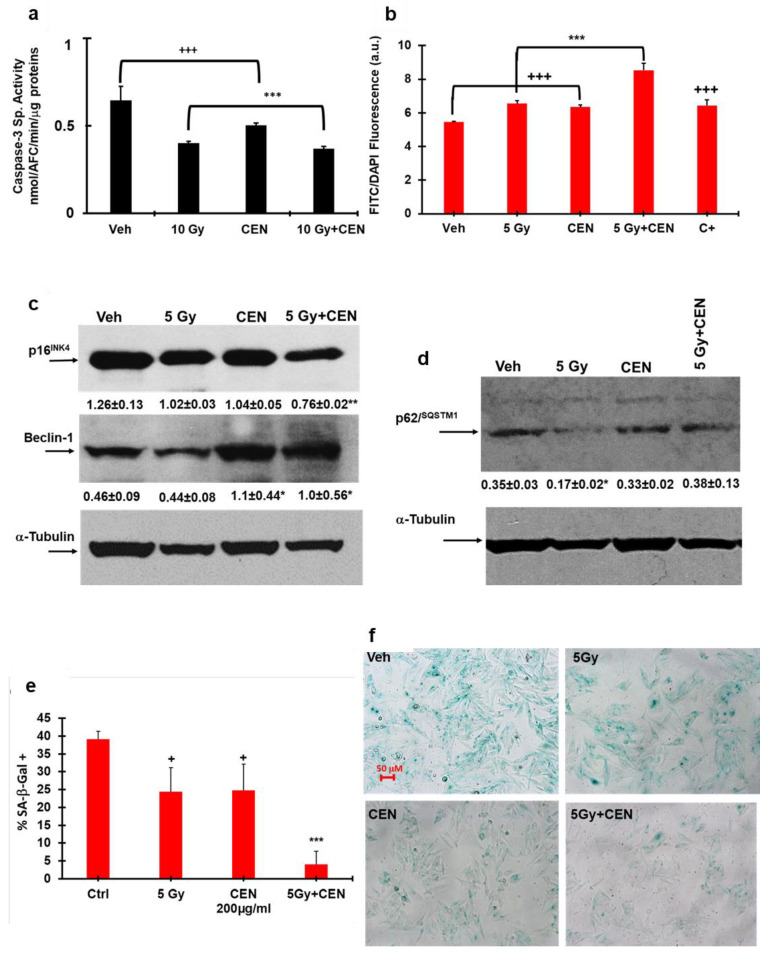
Figure 5.
Irradiation and CEN do not induce apoptosis and modulate autophagy and senescence markers differently in SAOS400 cells. Panel (a): Caspase-3 enzymatic activity. The cells were irradiated (10 Gy) and then incubated with 200 μg/mL of CEN or their combinations, and after 24 h the cells were harvested, washed in PBS, and resuspended in caspase cell lysis buffer. Caspase-3 activity was measured fluorometrically using the specific substrate DEVD-AFC, as previously described [25]. Bar graphs represent the mean ± SD, and symbols and the linear bar indicate significance: +++ p < 0.01 CEN vs. Veh, *** p < 0.01 10 Gy and CEN vs. CEN + 10 Gy, Student’s t test. (b) Cyto-ID staining of SAOS400 cells irradiated with 5 Gy and treated for 120 h with 200 μg/mL of CEN or their combinations. CLO (20 μM) was used as a positive control in this experiment (C+). The bar graphs represent the mean ± SD, and symbols and the linear bar indicate significance: +++ p < 0.001 IR and CEN vs. Veh, *** p < 0.001 CEN + IR vs. single treatments (Student’s t test). Panels (c,d): Immunoblot analysis of autophagy markers (Beclin-1, p62SQSTM1) and senescence markers (p16INK4) in SAOS400 cells irradiated with 5 Gy or incubated with 200 μg/mL of CEN and their combination for 144 h. Densitometric analysis (numbers between panels indicate mean ± SD) was calculated normalizing the expression of Beclin-1, p16INK4, and p62SQSTM1 with that of α-tubulin, as described in the Materials and Methods Section. Symbols indicate significance, * p < 0.05, ** p < 0.01 CEN + IR vs. IR or Veh (Student’s t test). Panel (e): SA-β-GAL staining of SAOS400 cells irradiated (5 Gy) and then treated for 144 h with 200 μg/mL of CEN or their combination Symbols indicate significance + p < 0.05 IR or CEN vs Ctrl *** p < 0.01 CEN + IR vs. IR and CEN. Panel (f): Micrographs of representative fields of SAOS400 cells after SA-β-GAL staining (200× magnification).

