Figure 6.
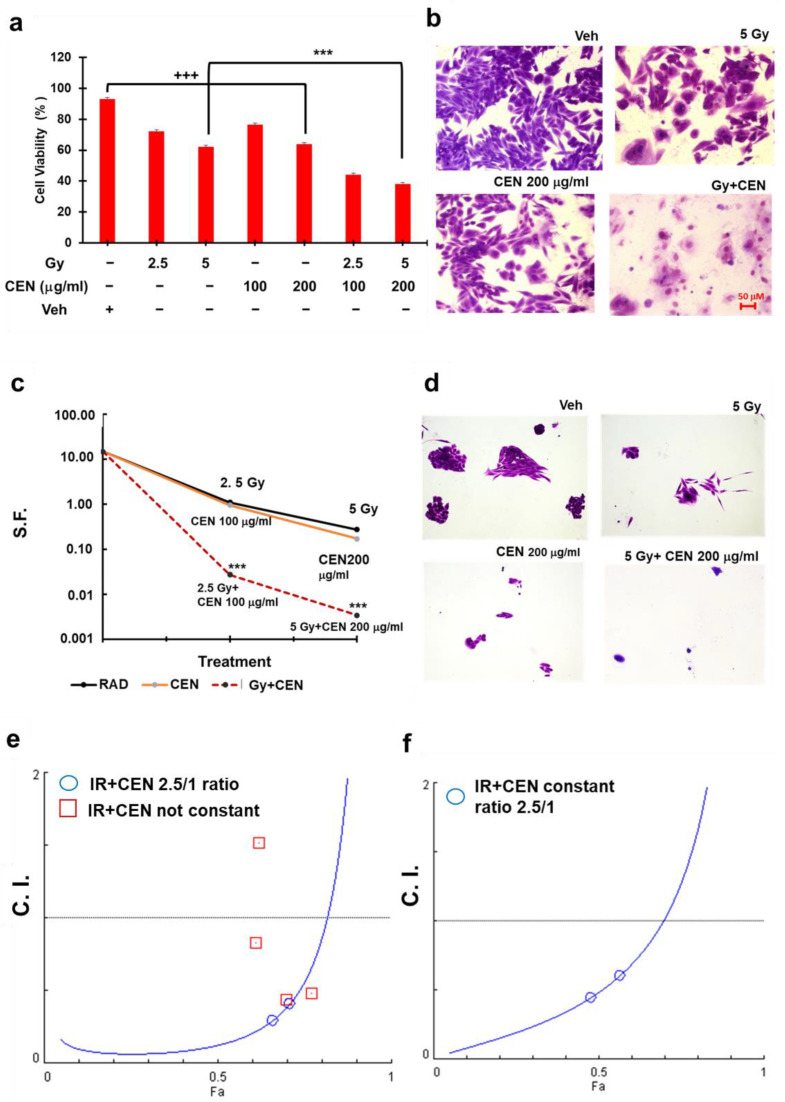
Irradiation and CEN synergistically induce cell death in the SAOS400 cell line. Panel (a): Crystal Violet assay in SAOS400 irradiated with 2.5 or 5 Gy and treated for 120 h with 100 or 200 μg/mL of CEN or their combination. The bar graphs represent the mean ± SD, and symbols and the linear bar indicate significance: +++ p < 0.001 Veh vs. IR- or CEN-treated cells, *** p < 0.001 CEN + IR vs. single treatments, Student’s t test. (b) Micrographs (200× magnification) of representative fields of SAOS400 cells treated as described in (a) and subsequently fixed and stained with Crystal Violet. Panel (c): Clonogenic assay. SAOS400 cells were irradiated with 2.5 or 5 Gy or incubated with 100–200 μg/mL of CEN and their combination for 11 days. Bar graphs represent the mean of the surviving fraction (SF) ± SD; in other words, the colonies that survived after each treatment (CEN, radiation, or combinations) with respect to untreated cells considering the plating efficiency in the clonogenic assay, as explained in the Materials and Methods Section. Symbols indicate significance: *** p < 0.001 CEN + IR vs. single treatments, Student’s t test. Panel (d): Micrographs (100× magnification) of representative clones of SAOS400 cells treated as described in panel (c) and subsequently fixed and stained with Crystal Violet. Panel (e): Isobologram that reproduces the calculation of the combination index (C.I., blue circle). The affected fractions (fa) were calculated based on the results obtained from the Crystal Violet assay using constant concentrations (radiation/CEN dose ratio 2.5/1). Panel (f): Isobologram showing the results of the C.I. analysis, where fa were calculated from the results of the clonogenic assay using constant (radiation/CEN dose ratio 2.5/1) (blue circles) or not constant concentrations (red squares).

