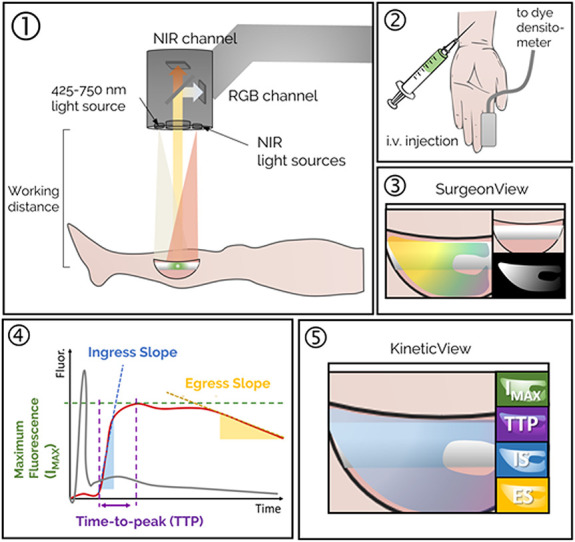
Figure 1.

Step 1: Fluorescence imaging system is positioned over the surgical field, and fluorescence video acquisition is started. Step 2: A dye densitometer finger probe acquires the time-dependent arterial dye concentration (called arterial input function). Dye is injected intravenously. Step 3: Real-time fluorescence video, including overlay onto the color image of the surgical field, is displayed on the “SurgeonView.” Step 4: Collection of video rate recorded data allows for analysis of the inflow/outflow kinetics, which can be assessed using several parameters including maximum fluorescence intensity (Imax), time-to-peak (TTP), ingress or inflow slope (IS), and egress or outflow slope (ES). These parameters are computed for the time–concentration curve of each pixel (solid red line), corrected to account for differences in arterial input function (solid gray line), to produce kinetic maps. Step 5: The kinetic maps can then be displayed on a secondary monitor “KineticView” so that both the real-time SurgeonView information and the computed KineticView information are available intraoperatively.
