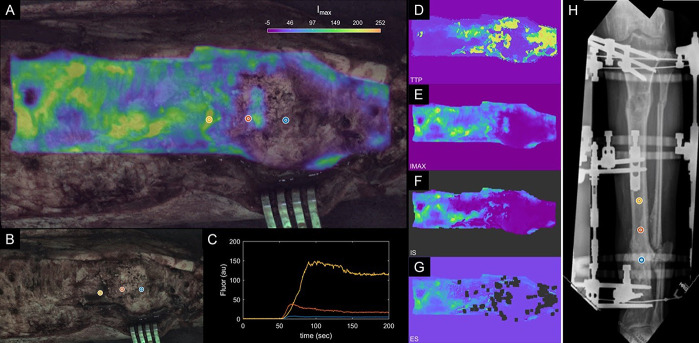
Figure 3.
A, “Enhanced DCE view” of patient 1 data showing maximum intensity heat map overlaid on the white light image. B, White light intraoperative image. C, Kinetic ICG inflow/outflow curves at regions of interest identified with blue, red, and yellow dots. D–G, Kinetic heat maps representing ICG time-to-peak (D), maximum ICG intensity (E), ICG inflow slope (F), and ICG outflow slope (G). H, AP radiographs with regions of interest (blue, red, yellow). ICG, indocyanine green.

