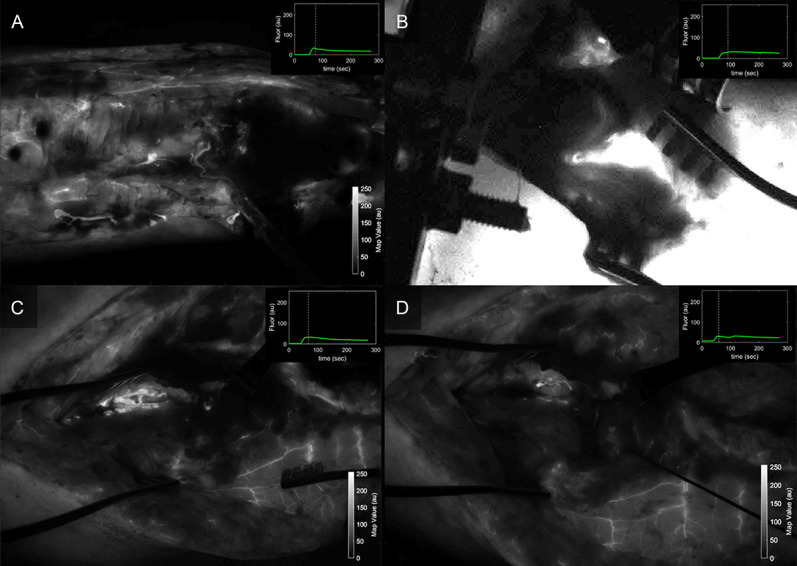
Figure 8.

Fluorescence intensity maps acquired during the early wash-out period after ICG injection for (A) patient 1, (B) patient 2, and patient 3 (C) predebridement and (D) postdebridement, as seen with the SPY Elite standard visualization available in clinical units. ICG, indocyanine green.
