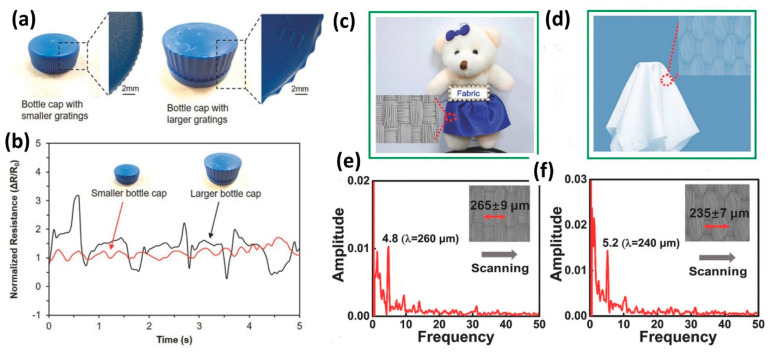
Figure 18.
(a) Photographs of bottle caps with different size and grating parameters. Inset shows the magnified images of the small bottle cap with 0.5 mm grating height, and the larger bottle cap with 1 mm grating height, respectively. (b) Dynamic electrical profile of the sensor scanning across the smaller bottle cap (red), and larger bottle cap (black). (c,d) The pictures of two fabrics (fabric A and B) that have different warp and weft densities. The inset figures are the SEM images. (e,f) The FFT wave patterns of fabric A and B, respectively, and the texture dimensions are calculated as 260 and 240 µm by the function f = v/λ. The insets of (e,f) show the scanning direction and the average dimensions of two fabrics (265 ± 9 and 235 ± 7 µm, respectively) measured from the SEM images. Reprinted/adapted with permission from Ref. [179]. Copyright 2017, Wiley-VCH GmbH.

