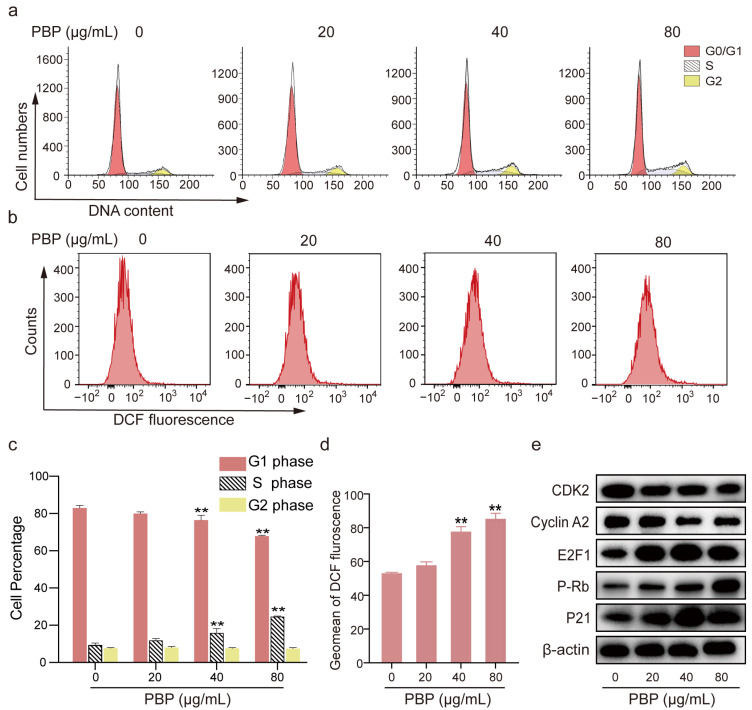
Figure 7.
PBP arrested A549 cells in S phase and caused ROS production. (a) A549 cells were stained with PI and evaluated using flow cytometry after PBP (0, 20, 40 or 80 μg/mL) treatment for 48 h; (b) A549 cells were stained with the ROS indicator (DCF-DA) and analyzed by flow cytometry after PBP treatment for 48 h; (c) Analysis quantitative of the cell cycle distribution of A549 cells treated with PBP; (d) Quantitative analysis of the DCF fluorescence geomean in A549 cells treated with PBP; (e) Western blot analysis of proteins related to S phase arrest. Data are presented as the mean ± SD (n = 3) by One-way ANOVA analyses. ** p < 0.01 versus control (0 μg/mL PBP).

