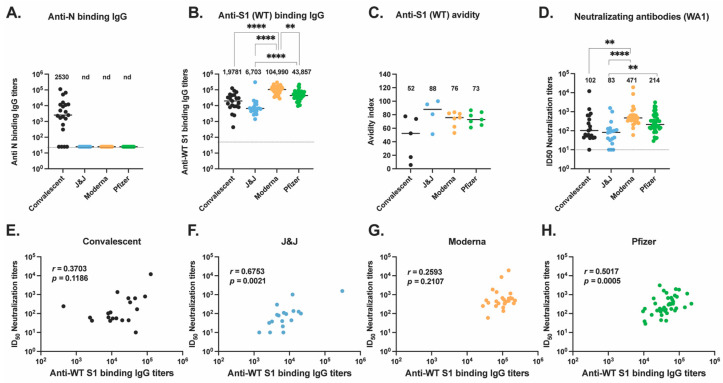
Figure 1.
Antibody responses to ancestral SARS-CoV-2 elicited by vaccination or natural infection. (A) Anti-N IgG antibody titers (B) Anti-S1 IgG antibody titers were assessed for convalescent (black, n = 21), J&J (blue, n = 20), Moderna (orange, n = 28), and Pfizer (green, n = 47) participants. (C) Anti-S1 (WT) IgG antibody avidity assessed using urea wash ELISA. Data expressed as a ratio of urea-washed absorbance to unwashed absorbance for convalescent (black, n = 5), J&J (blue, n = 4), Moderna (orange, n = 7), and Pfizer (green, n = 7) participants. (D) Neutralizing antibody titers are shown as log10 of half-maximal inhibitory dilution (ID50) for convalescent (black, n = 19), J&J (blue, n = 18), Moderna (orange, n = 25), and Pfizer (green, n = 43) participants. For plots A to C, ** p < 0.01, and **** p < 0.0001 by Kruskal–Wallis test. Dotted line shows limit of detection of the assays. Median is shown by black horizontal bar and values above each group, with data below the limit of detection, marked nd for non-detected. (E–H) Correlations between neutralizing antibody titers (ID50) and binding antibody titers for the (E) convalescent, (F) J&J, (G) Moderna, and (H) Pfizer groups. Spearman’s r and p values are shown.

