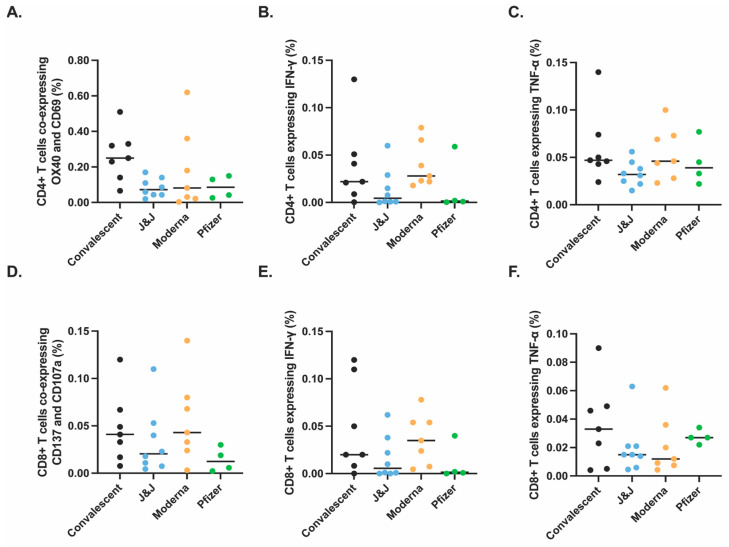
Figure 2.
Similar antigen-specific T cells responses observed after vaccination or infection. SARS-CoV-2 specific T cell responses after vaccination or natural infection analyzed by spectral flow cytometry (Figure S1). PBMCs isolated from convalescent (black, n = 7), J&J (blue, n = 8), Moderna (orange, n = 7), and Pfizer (green, n = 4) participants were analyzed for SARS-CoV-2 spike-specific CD4+ (A–C) and CD8+ (D–F) responses. Significance tested by Kruskal–Wallis test. y-axis indicates proportion of total CD4+ or CD8+ T cells that express the indicated activation markers or cytokines.

