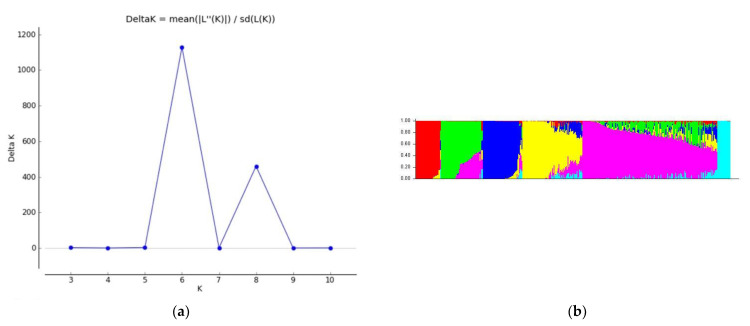
Figure 1.
(a) Evaluation of STRUCTURE outputs; (b) estimated population structure. (a) The change in log probability of ΔK value (K); (b) the estimations of population structure at K = 6 for 400 inbred lines. Each inbred line is represented as a vertical segment, which is partitioned into 6 colored segments to denote estimated membership to the K cluster.

