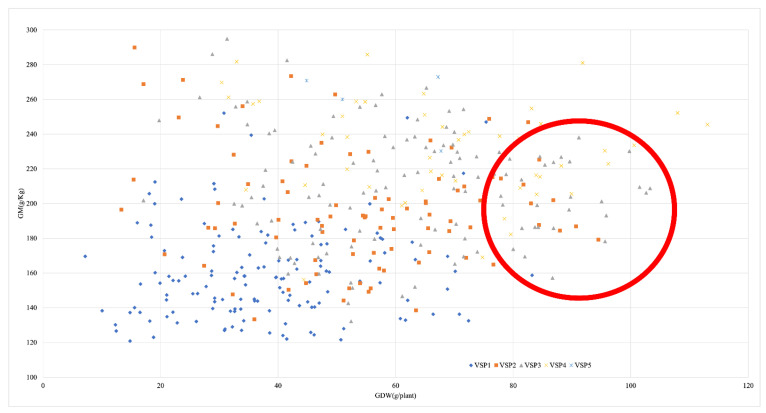
Figure 2.
Comparison of early senescence and late senescence genotypes with agronomical traits. GM—grain moisture in grams/plant; GDW—grain dry weight in grams/plant; VSP1—genotypes correspond to a visual scale of plant value 1 (completely dry) at 45 DAA; VSP2—genotypes correspond to a visual scale of plant value 2 (partial green) at 45 DAA; VSP3—genotypes correspond to a visual scale of plant value 3 (intermediate green, intermediate dry) at 45 DAA; VSP4—genotypes corresponds to a visual scale of plant value 4 (partial dry) at 45 DAA; VSP5—genotypes corresponds to a visual scale of plant value 5 (complete green) at 45 DAA; Red circle—exceptional genotypes to the relationship between plant visual scale and grain moisture and yield.

