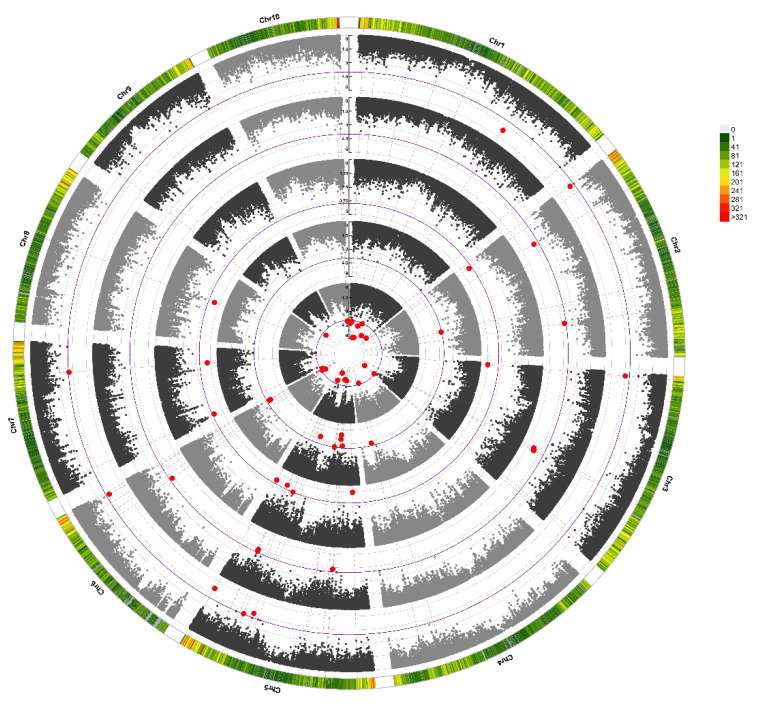
Figure 4.
Circular Manhattan Plot. Red dots are significant SNPs for corresponding senescence traits. From inside to out: VSH—visual scale of husk leaves at 45 DAA; VSP—visual scale of plant at 45 DAA; SC—stomatal conductance; PHVDIF—the difference between the visual scale of plant and husk at 45 DAA; PA—photosynthesis activity at 45 DAA.

