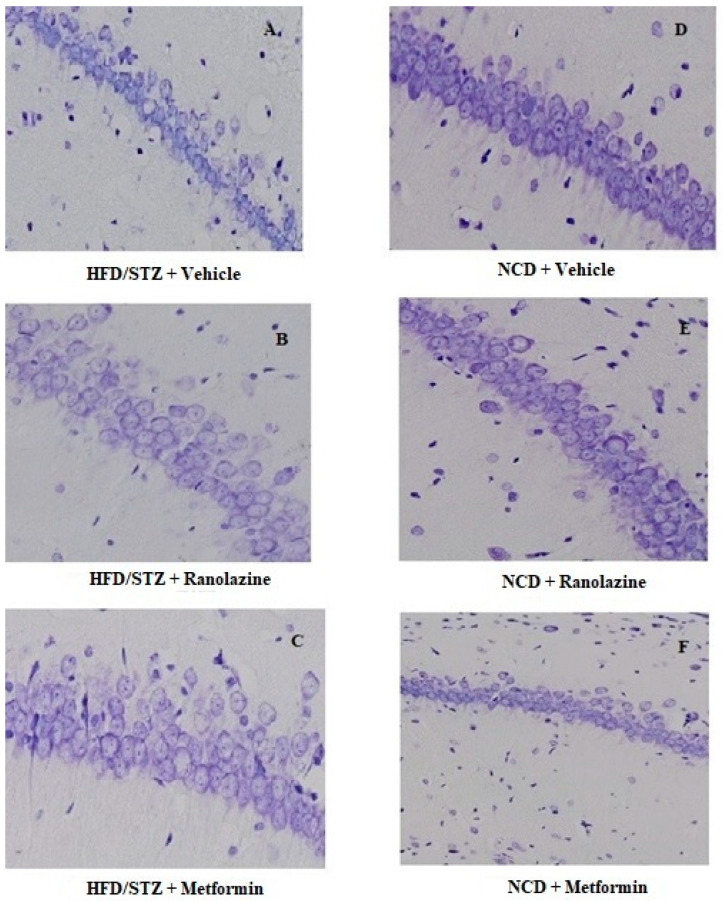
Figure 1.
Representative images of histological analysis. Magnification 20x. Cresyl violet staining was performed on a section from the hippocampal CA1 region in (A) HFD/STZ + Vehicle group, (B) HFD/STZ + Ranolazine group, (C) HFD/STZ + Metformin group, (D) NCD + Vehicle group, (E) NCD + Ranolazine group, (F) NCD + Metformin group. HFD = high fat diet; NCD = normocaloric diet; STZ = streptozotocin.

