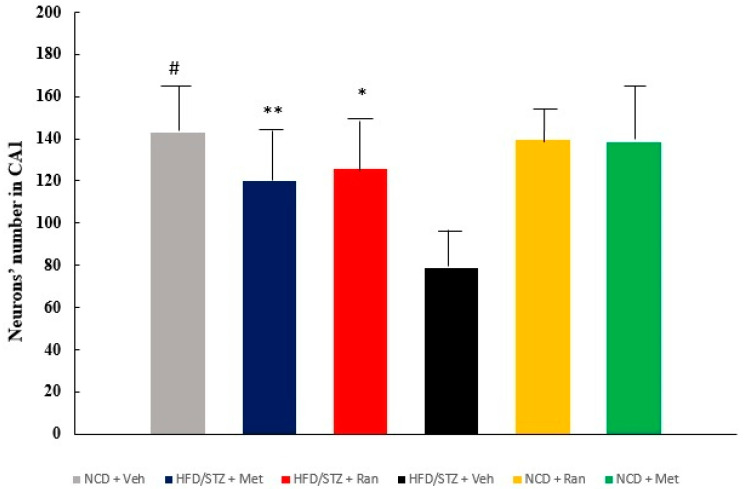
Figure 2.
Neuronal count in the hippocampal CA1 region of the six study groups. Values are the mean ± SD (n = 6 per group). * p = 0.0011 HFD/STZ + Vehicle vs. HFD/STZ + Ranolazine, ** p = 0.039 HFD/STZ + Vehicle vs. HFD/STZ + Metformin, # p < 0.0001 HFD/STZ + Vehicle vs. NCD + Vehicle (Sidak’s test). HFD = high fat diet; NCD = normocaloric diet; STZ = streptozotocin.

