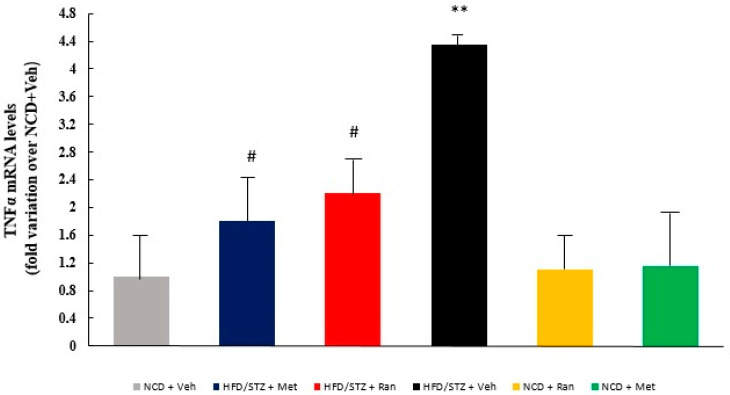
Figure 4.
TNFα in each experimental group. Data values are the mean ± SE (standard error) after normalization for 18S levels, and expressed as fold variation over NCD + Vehicle group. (n = 3–4 per group.) HFD = high fat diet; NCD = normocaloric diet; STZ = streptozotocin; Ran = ranolazine; Met = metformin; GFAP= glial fibrillary acidic protein. ** p = 0.01 HFD/STZ + Vehicle vs. NCD + Vehicle, # p= 0.01 HFD/STZ + Metformin and HFD/STZ + Ranolazine vs. HFD/STZ + Vehicle.

